Get ahead
VMware offers training and certification to turbo-charge your progress.
Learn moreTable of Contents
Micrometer is a dimensional-first metrics collection facade whose aim is to allow you to time, count, and gauge your code with a vendor neutral API. Through classpath and configuration, you may select one or several monitoring systems to export your metrics data to. Think of it like SLF4J, but for metrics!
Micrometer is the metrics collection facility included in Spring Boot 2’s Actuator. It has also been backported to Spring Boot 1.5, 1.4, and 1.3 with the addition of another dependency.
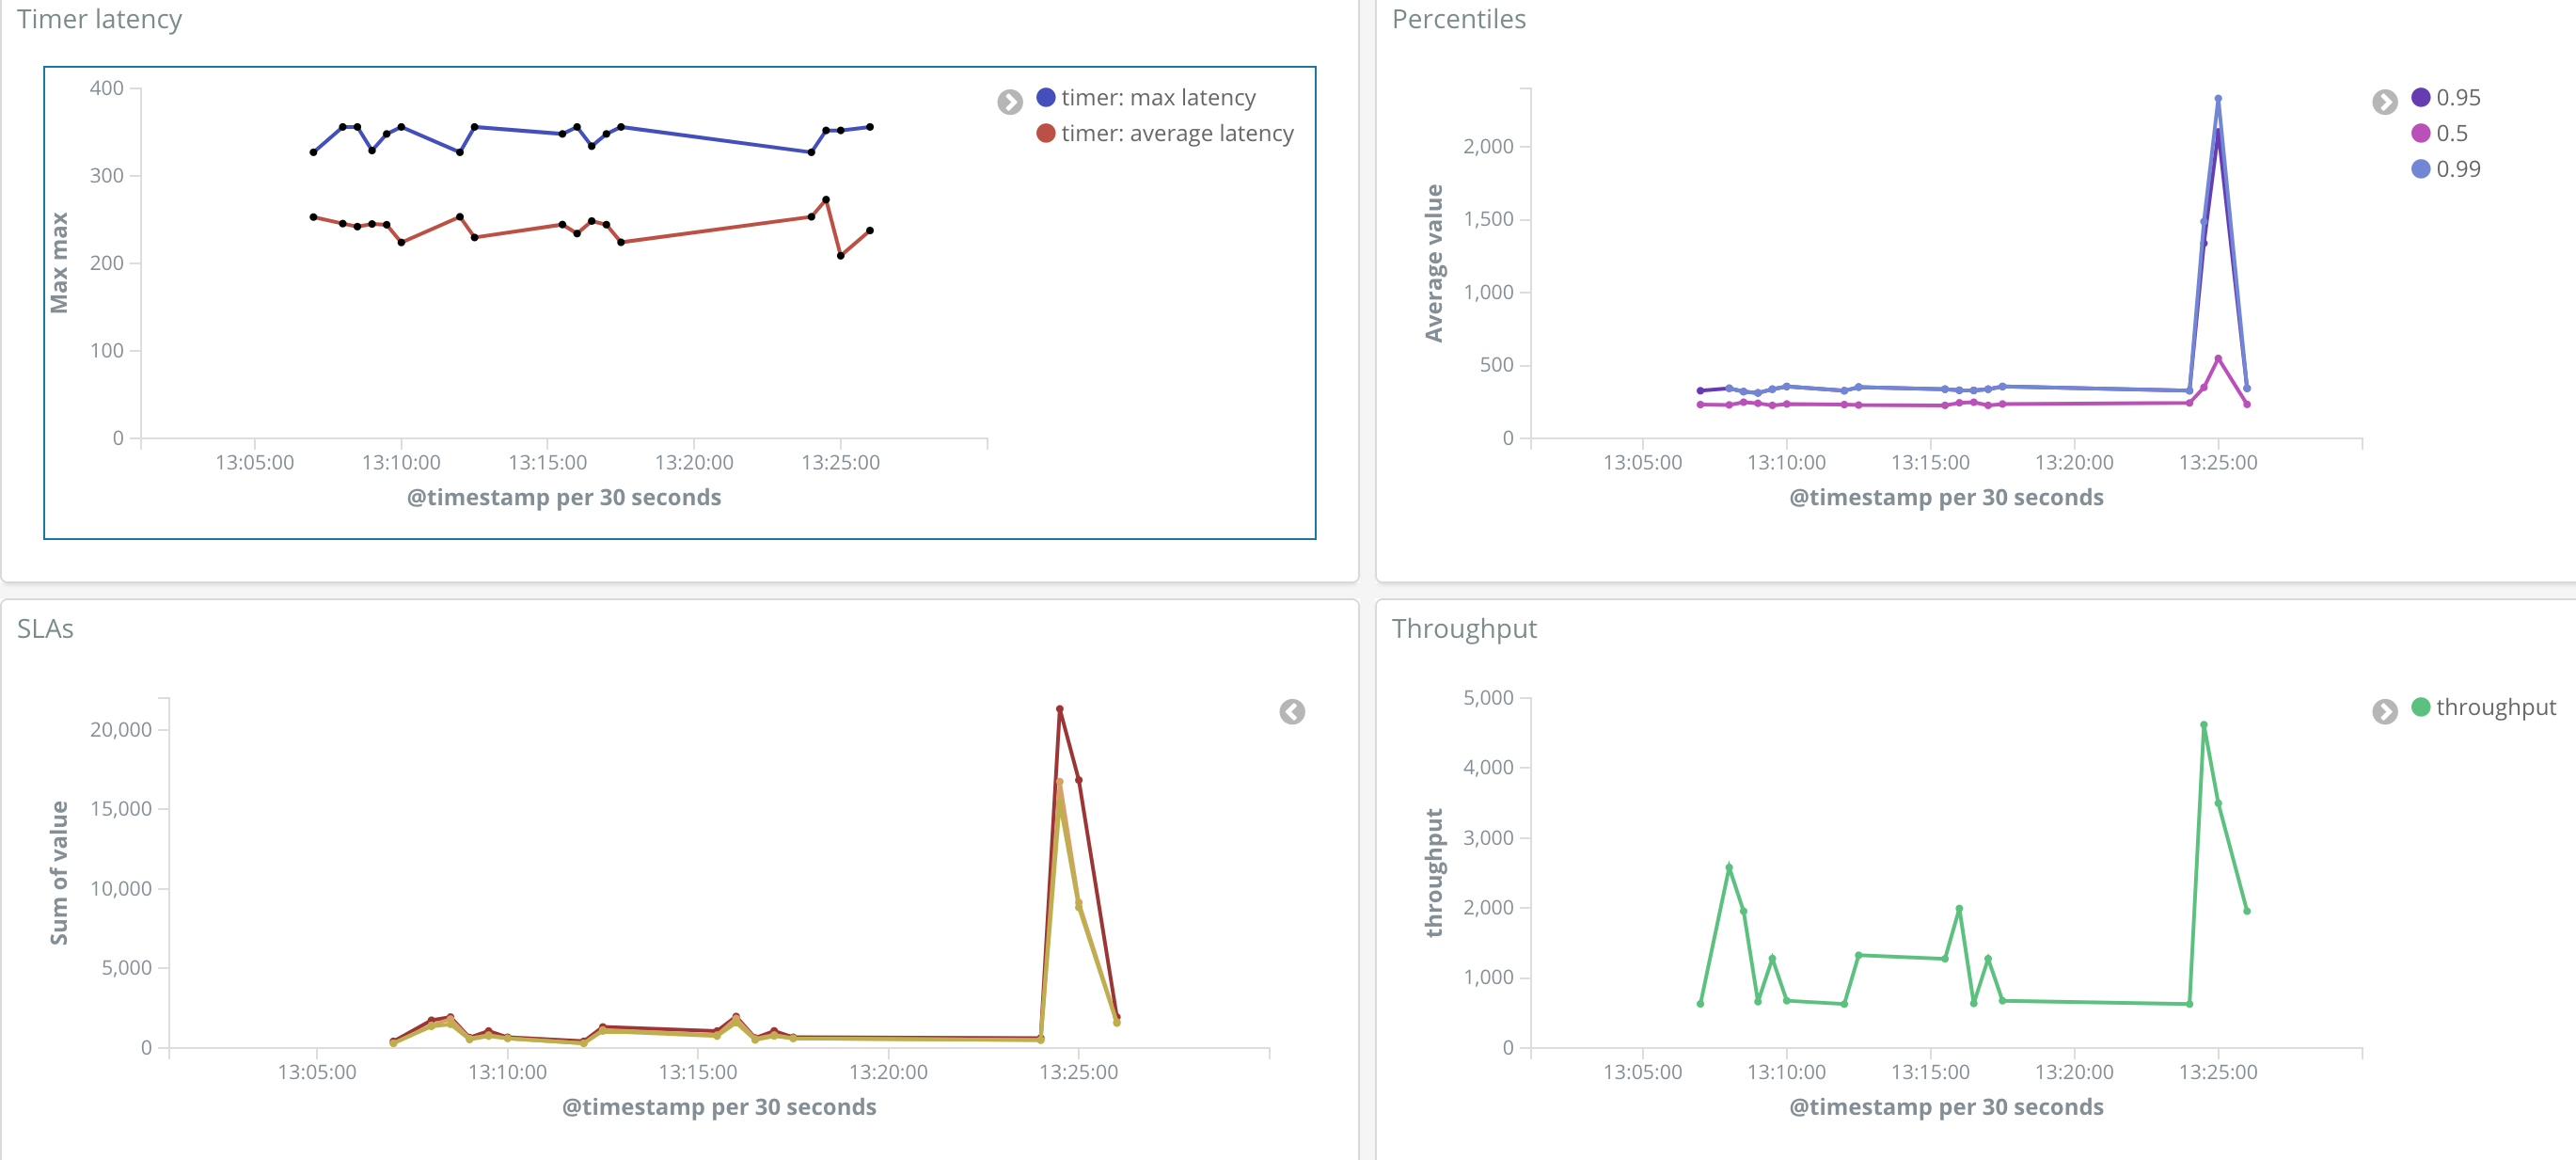
Micrometer adds richer meter primitives to the counters and gauges that existed in Spring Boot 1. For example, a single Micrometer Timer is capable of producing time series related to throughput, total time, maximum latency of recent samples, pre-computed percentiles, percentile histograms, and SLA boundary counts.
Despite its focus on dimensional metrics, Micrometer does map to hierarchical names to continue to serve older monitoring solutions like Ganglia or narrower scoped tools like JMX. The change to Micrometer arose out of a desire to better serve a wave of dimensional monitoring systems (think Prometheus, Datadog, Wavefront, SignalFx, Influx, etc). One of Spring’s strengths is the enablement of choice through abstraction. By integrating with Micrometer, Spring Boot is enabling you to choose one or more monitoring systems to use today, and change your mind later as your needs change without requiring a rewrite of your custom metrics instrumentation.
Before opting to develop "yet another" metrics collection library, we looked hard at existing or up-and-coming dimensional collectors. But as we looked at exporting to more and more monitoring systems, the importance of the structure of names and data became apparent. Micrometer builds in concepts of naming convention normalization, base unit of time scaling, and support for proprietary expressions of structures like histogram data that are essential to make metrics shine in each target system. Along the way, we added meter filtering as well, allowing you to exercise greater control over the instrumentation of your upstream dependencies.
Tip
To learn more about Micrometer’s capabilities, please refer to its reference documentation, in particular the concepts section.
Spring Boot 2 autoconfigures quite a few metrics for you, including:
JVM, report utilization of:
Various memory and buffer pools
Statistics related to garbage collection
Thread utilization
Number of classes loaded/unloaded
CPU usage
Spring MVC and WebFlux request latencies
RestTemplate latencies
Cache utilization
Datasource utilization, including HikariCP pool metrics
RabbitMQ connection factories
File descriptor usage
Logback: record the number of events logged to Logback at each level
Uptime: report a gauge for uptime and a fixed gauge representing the application’s absolute start time
Tomcat usage
Many of these metrics existed in a form in Spring Boot 1, but have been enriched with greater detail and tags in Spring Boot 2.
Micrometer provides a vendor-neutral metrics collection API (rooted in io.micrometer.core.instrument.MeterRegistry) and implementations for a variety of monitoring systems:
Netflix Atlas
CloudWatch
Datadog
Ganglia
Graphite
InfluxDB
JMX
New Relic
Prometheus
SignalFx
StatsD (Etsy, dogstatsd, Telegraf, and proprietary formats)
Wavefront
Support for additional systems is underway or planned for the 1.1.0 release slated for mid-2018:
AppOptics
Azure Application Insights
Dynatrace
Elasticsearch
StackDriver
Spring Boot 2 configures a composite MeterRegistry to which any number of registry implementations can be added, allowing you to ship your metrics to more than one monitoring system. Through, MeterRegistryCustomizer, you can customize the whole set of registries at once or individual implementations in particular. For example, a commonly requested setup is to (1) export metrics to both Prometheus and CloudWatch, (2) add a set of common tags to metrics flowing to both (for example, host and application identifying tags) and (3) whitelist only a small subset of metrics to CloudWatch.
By metrics, we specifically mean the class of information that allows you to reason about the performance of a system in the aggregate (across different components of a single app, instances of an in a cluster, clusters operating in different environments or regions, etc.).
Notably this excludes information intended to reason about the contribution of various components to the total latency of a single request as it passes through a series of services; this is the responsibility of distributed tracing collectors like Spring Cloud Sleuth, Zipkin’s Brave, etc.
Distributed tracing systems provide detailed information about subsystem latency, but generally downsample in order to scale (e.g. Spring Cloud Sleuth ships 10% of samples by default). Metrics data is generally pre-aggregated and so naturally lacks correlative information, but is also not downsampled. So, for a series of 100,000 requests in a minute interval that feature an interaction with service A and, depending on the input, maybe an interaction with service B:
Metrics data will tell you that in the aggregate, service A’s observed throughput was 100k requests and service B’s observed throughput was 60k requests. Additionally, in that minute, service A’s max overall average latency was 100ms and service B’s max overall average latency was 50ms. It will also provide information on maximum latencies and other distribution statistics in that period.
A distributed tracing system will tell you that for a particular request (but not the entire population of requests, because remember downsampling is happening), service A took 50 ms and service B took 90ms.
You might reasonably infer from the metrics data that roughly half the time spent in the worst-case user experience was spent in each of A and B, but you can’t be certain since you are looking at an aggregate, and it is entirely possible that in the worst case all 100ms was spent in service A and B was never called at all.
Conversely, from tracing data you cannot reason about throughput over an interval or the worst-case user experience.
Spring Boot 1’s metrics interfaces were hierarchical in nature. This means that published metrics were identified entirely by their name. So you might have a metric named jvm.memory.used.
When you’re looking at metrics from a single application instance, this seems suitable. But what if you have 10 instances all publishing jvm.memory.used to the same monitoring system? How do we distinguish between them in the event that memory consumption spikes unexpectedly on one instance?
The answer is generally to add to the name, for example by adding a prefix or suffix to the name. So we might change the name to ${HOST}.jvm.memory.used, where we substitute ${HOST} for the host name. After redeploying all 10 instances, we now can identify which instance is under memory pressure. And in a typical hierarchical monitoring system, we can reason about the sum of memory used across all instances by wildcarding the name somehow:
*.jvm.memory.used
Suppose now we have 10 application instances in each of 3 deployment regions. Further, we want to reason about the average or maximum memory footprint of our application by region. Now, if we add an additional prefix to the metric name (so that it looks like ${REGION}.${HOST}.jvm.memory.used, we have broken our existing queries. We could update the query to reason about the sum of memory used across all instances:
*.*.jvm.memory.used
Unfortunately, this blinds us on our existing infrastructure until it has all been redeployed with the new prefix. This is just an example of one limitation of the hierarchical naming approach.
We mentioned already that Micometer is a dimensional-first metrics collector. The same metric in Micrometer would have been recorded with tags (a.k.a. dimensions):
Gauge.builder("jvm.memory.used", ..)
  .tag("host", "MYHOST")
  .tag("region", "us-east-1")
  .register(registry);
Dimensional monitoring systems naturally display jvm.memory.used in the aggregate across all tags until you drill into one or more of them. A query in a dimensional monitoring system would select the name first (jvm.memory.used) and allow for subsequent filtering by tag. In our scenario from above, if we had an existing chart/alert based on exploding memory consumption by host and then later added an additional tag for region, the host-based query would continue to work uninterrupted as the new region-imbued metrics rolled out across your infrastructure.
Meter filters allow you to control how and when meters are registered and what kinds of statistics they emit. Meter filters serve three basic functions:
Deny (or accept) meters from being registered.
Transform meter IDs (e.g. changing the name, adding or removing tags, changing description or base units).
Configure distribution statistics for some meter types (e.g. percentiles, histograms, SLAs for timers and distribution summaries).
Spring Boot 2 binds a series of properties to an out-of-the-box meter filter that allows you to control metrics emission through properties. For example:
management.metrics.enable.jvm=false
management.metrics.distribution.percentiles-histogram.http.server.requests=true
management.metrics.distribution.sla.http.server.requests=1ms,5ms
The above turns off all metrics beginning with the prefix "jvm", publishes percentile histograms for http server request metrics that are autoconfigured by Spring Boot, and ships counts of requests less than or equal to 1ms and 5ms SLA boundaries so you can see exactly how many requests are meeting your expectations. The SLA distribution configuration is also the core feature that enables you to visualize more complicated measurements like Apdex scores.
You can flip enablement of metrics entirely at the root to generate a whitelist for just a handful of metrics you want. Suppose you want JVM metrics and nothing else:
management.metrics.enable.all=false
management.metrics.enable.jvm=true
It was trivial to provide a single REST endpoint that listed all metrics in Spring Boot 1, because we only had counters and gauges and both were hierarchical. More complex types like timers represent more than one time series (they contain at a minimum a count, a maximum, and a total sum). Also, our metrics went dimensional. It quickly became clear that there was no way to output all this information in a single payload. Even for a dimensional counter, do we display an aggregate for every permutation of tags? Flattening to hierarchical names for brevity, this turns into something like this:
http.server.requests.method.GET.response.200.uri./foo=100
http.server.requests.method.GET.response.500.uri./foo=1
http.server.requests.method.GET.response.200.uri./bar=5
http.server.requests.method.GET.response.400.uri./foo=1

# and now the aggregates...
http.server.requests.method.GET=107
http.server.requests.method.GET.response.200=105
http.server.requests.method.GET.uri./foo=101
http.server.requests.response.200.uri./foo=100
http.server.requests.response.500.uri./foo=1
http.server.requests.response.200.uri./bar=5
...
As you can see, this quickly becomes untenable. If you were wanting to build a custom UI, for example, on the contents of MeterRegistry and you know that your UI is only interested in http throughput by URI irrespective of the method, status, etc then the output can be substantially curtailed. For these kinds of cases, we recommend creating a component that presents your UI with just the data that it needs. Inject MeterRegistry into your component and use its find and get methods to search for the metrics you need to expose. Then serialize them in a format that is tailored to your use.
Micrometer support is available on slack at slack.micrometer.io, on Twitter @micrometerio, and on Github. Don’t hesitate to reach out with questions, suggestions, or problems!

VMware offers training and certification to turbo-charge your progress.
Learn moreTanzu Spring Runtime offers support and binaries for OpenJDK™, Spring, and Apache Tomcat® in one simple subscription.
Learn moreCheck out all the upcoming events in the Spring community.
View all