Get ahead
VMware offers training and certification to turbo-charge your progress.
Learn moreThe Spring Cloud Data Flow team is pleased to announce the release of 2.0 M2 of Data Flow. Follow the Getting Started guides for running on Local, Cloud Foundry, and Kubernetes.
Hand in hand is the 2.0 M2 release of Spring Cloud Skipper. The getting started section in the reference guide is the best place to start if you want to use Skipper separately from Data Flow.
Launch tasks against multiple platforms
Revamped metrics and monitoring of deployed applications
Additional security roles
Dashboard improvements
Database migration support
When a task is launched you can specify the platform where it will execute. The Data Flow server lets you configure multiple Kubernetes and Cloud Foundry task platforms. This is particularly useful when you want to orchestrate data pipelines against multiple platforms, but manage them all from a central location.
For example, if you are running Data Flow on Cloud Foundry in org1/space1, you can launch tasks in org2/space2. If running the Data Flow server locally, you can specify different local task platforms, say with different JVM properties, as an alternative to using task deployment properties. The docs describe how to configure multiple task platforms for Local, Cloud Foundry, and Kubernetes
Data Flow 2.0 introduces a new architecture for collecting and displaying application metrics for Streams. The Data Flow Metrics Collector introduced in Data Flow 1.4 has been removed.
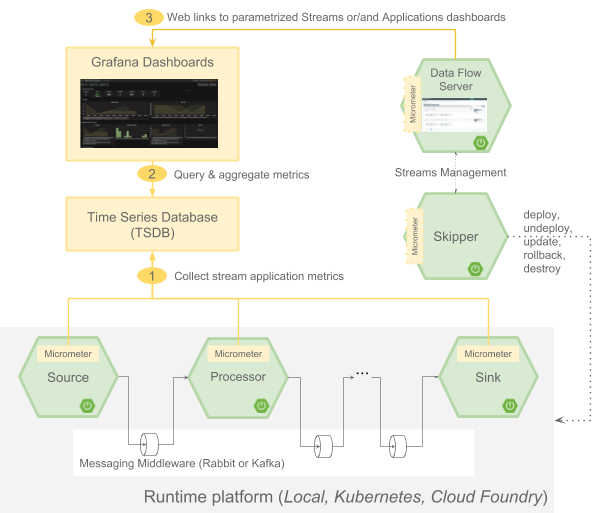
This new architecture is based on using the Micrometer library in the deployed applications to send metrics to popular monitoring systems and then visualizing the metrics with Grafana. Each application in the Einstein release train of the application starters contains Micrometer libraries for Prometheus, InfluxDB and DataDog.
We have provided instructions on how to get started using Prometheus and InfluxDB as the monitoring system for Data Flow running locally on your laptop. Instructions for CloudFoundry and Kubernetes will be available in the 2.0 RC1 release in a few weeks. Links to the Grafana dashboard from the Data Flow UI are also provided. Two Grafana dashboards are also provided, one that shows a more application centric view and other that show a more stream based view. Here is a screenshot of the Grafana dashboard based on Prometheus showing the message rates for the applications in a stream.
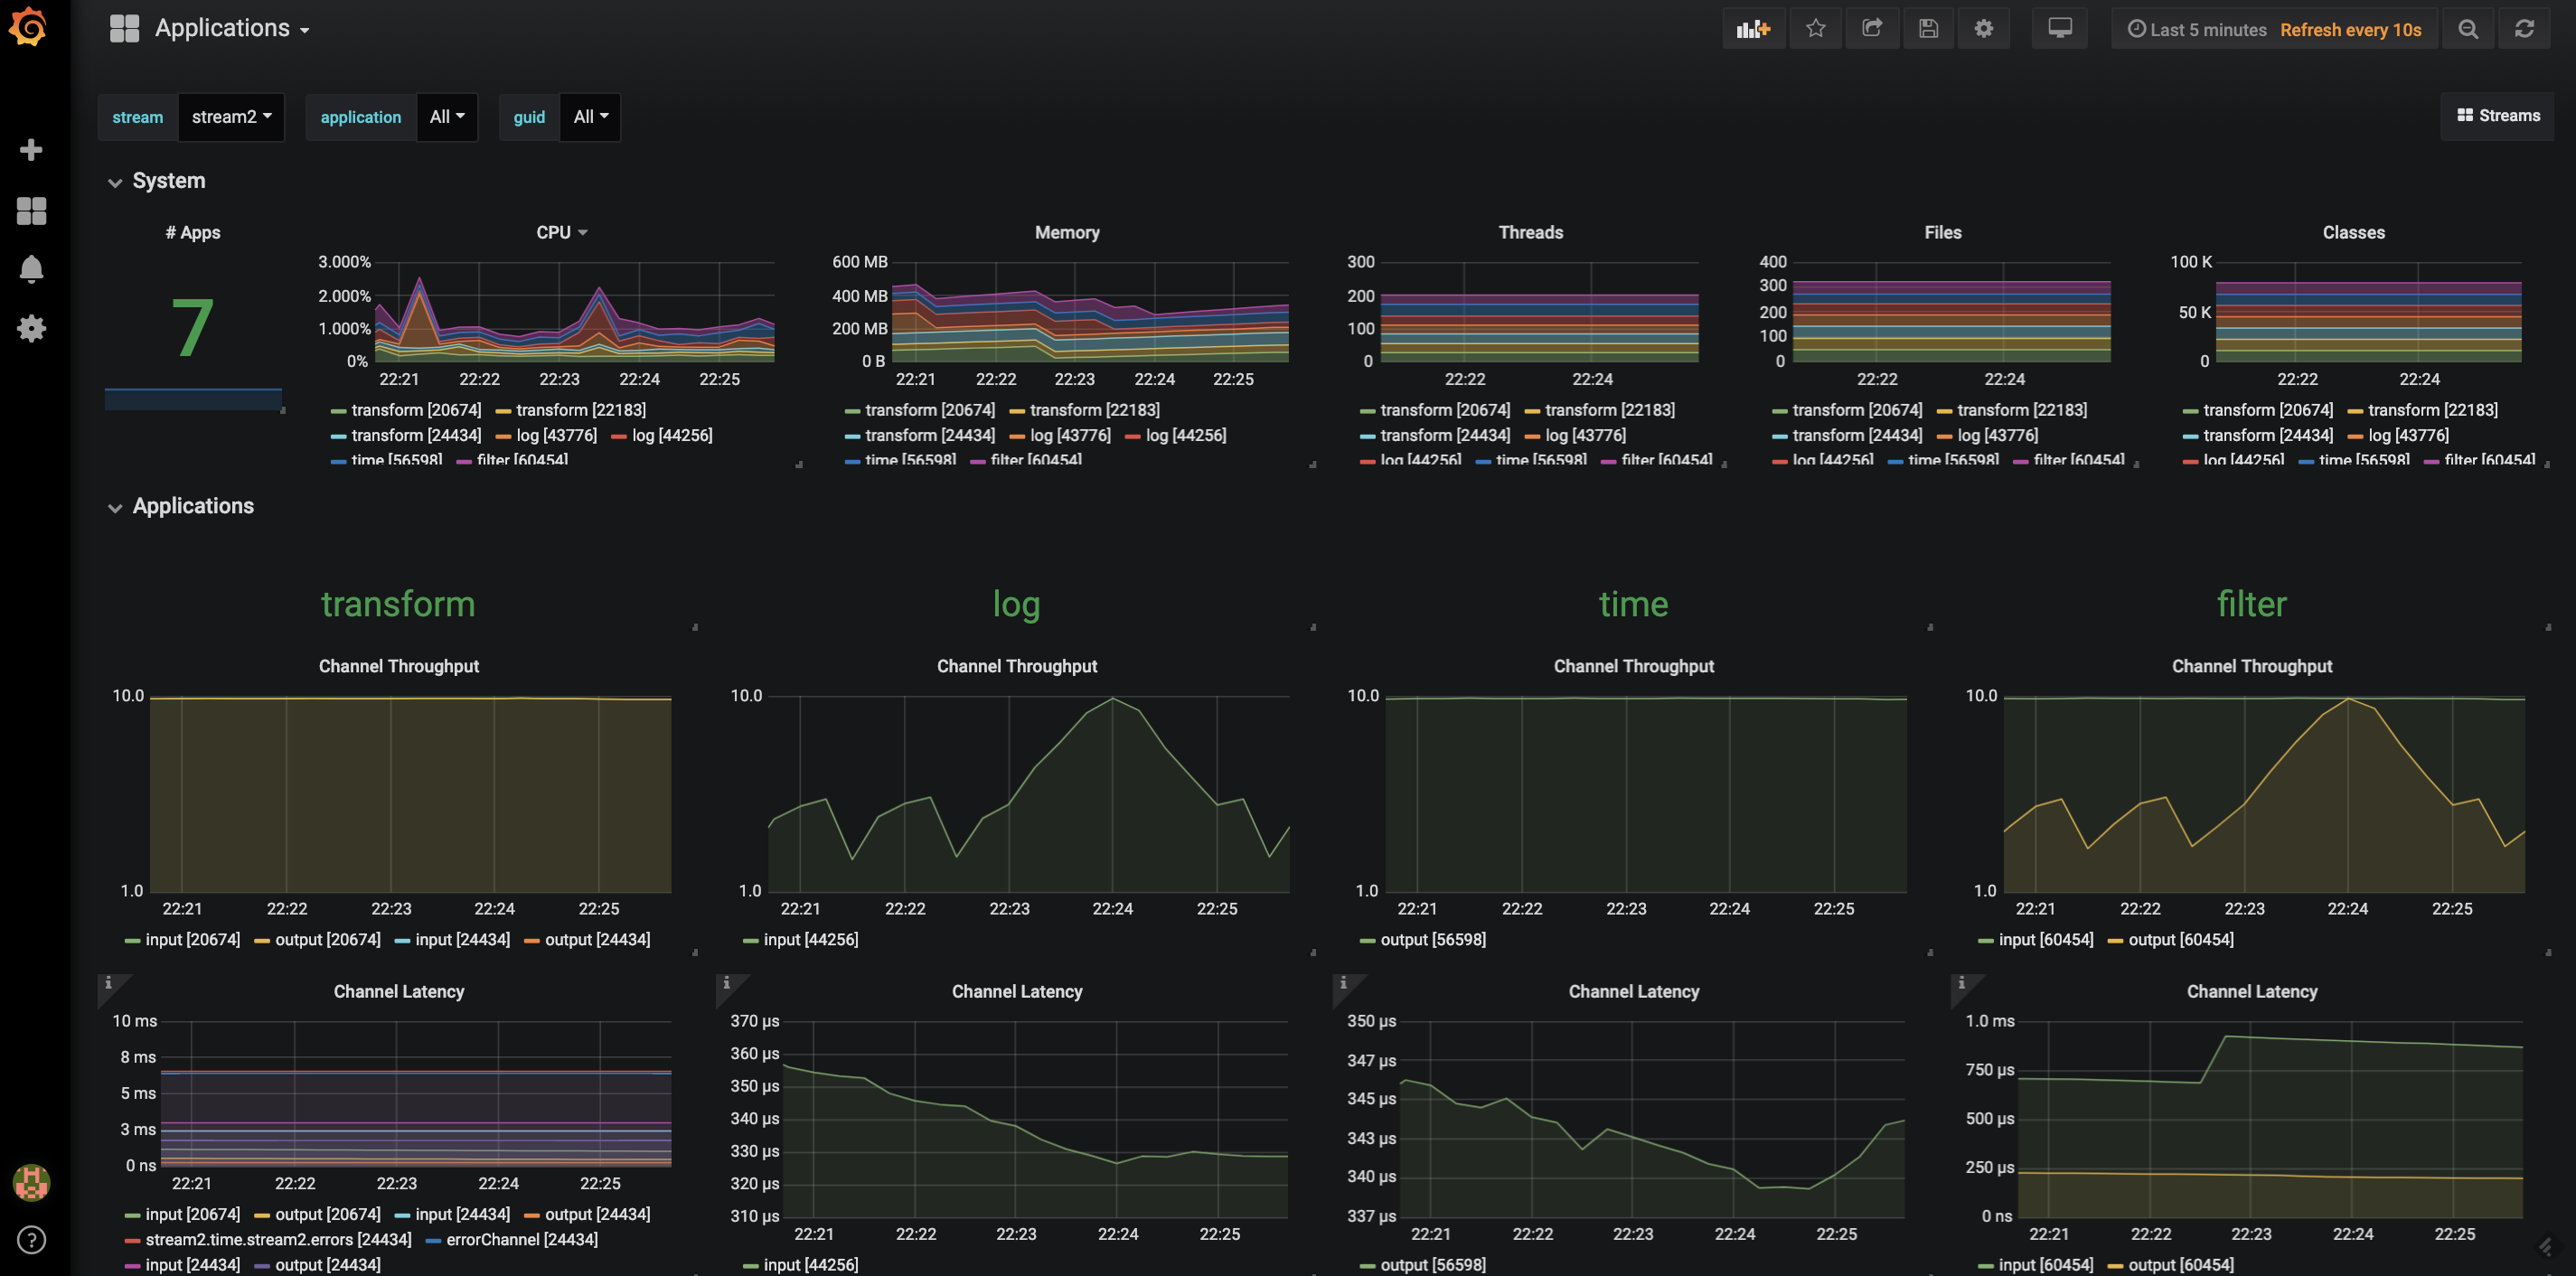
Selectors for applications and streams allows you to navigate down to specific areas of interest.
Data Flow 2.0 is entirely OAuth2/OpenIDConnect compatible. The token-based authorization, password-grant type validation, and LDAP integration are a few options, and they are consistently supported with the help of UAA as the backend.
Building on this foundation, in this milestone, we also added new granular roles to govern the stream/task deployment operations. The granularity brings better alignment with the intended action, and the client-tools (Shell and Dashboard) automatically also adapt to it.
The UI supports launching a Task against a collection of backend platforms. The UI/UX is built with a consistent experience for both Stream and Task launches.
Building upon another important feature-set, it is now possible to automatically enable/disable Dashboard functionality based on granular roles defined in Data Flow.
A Grafana launch-icon is natively integrated in Dashboard’s Streams and Runtime pages. With Data Flow configured against the available Micrometer backends, monitoring streaming-pipeline metrics such as message-rates, error-counts, and latency is just a click away!
A new button to rollback to the previous version of a stream is now supported.
The analytics tab has been removed and it will be replaced with Micrometer-based Grafana dashboard in the 2.0 RC1 release.
Schema changes were introduced in moving from Data Flow 1.7 to Data Flow 2.0. A flyway based migration is now included allowing you to easily update your existing stream/task definitions to the new format when starting up the 2.0 Data Flow server.
We are planning to release 2.0 RC1 in a couple weeks. Most of the feature development has been completed, but in addition to the monitoring improvements mentioned above, we will be adding support for getting the detailed history of Task deployments - application properties, deployment properties, much like is available today for Streams.
Also note that the 1.x line of Spring Cloud Data Flow will cease maintenance twelve months from the 2.0 GA announcement date. The 2.0 GA is tentatively planned for February 2019, so in February 2020, the 1.x line would reach end-of-general-support status.
As always, we welcome feedback and contributions, so please reach out to us on Stackoverflow or GitHub or via Gitter.

VMware offers training and certification to turbo-charge your progress.
Learn moreTanzu Spring Runtime offers support and binaries for OpenJDK™, Spring, and Apache Tomcat® in one simple subscription.
Learn moreCheck out all the upcoming events in the Spring community.
View all