Get ahead
VMware offers training and certification to turbo-charge your progress.
Learn moreHi Spring fans! In this brief series we’re going to look at the Spring Cloud integration for Google Cloud Platform, called Spring Cloud GCP. Spring Cloud GCP represents a joint effort between Google and Pivotal that endeavors to provide a first class experience for Spring Cloud developers when using the Google Cloud Platform. Pivotal Cloud Foundry users will enjoy an even easier integration with the GCP service broker. These installments were written with help from Google Cloud Developer Advocate, and my buddy, Ray Tsang. You can also catch a walkthrough of Spring Cloud GCP in our Google Next 2018 session, Bootiful Google Cloud Platform. Thanks buddy!
There are eight posts in the series. Here they all are:
As we move more and more applications to the cloud, and introduce more and more microservices, the complexity of understanding what’s gone wrong - and where?? - grows. Distributed tracing addresses this problem. Distributed tracing, in theory, is a simple chore. For every request that enters or exits the system.. for every ingres or egress int he system, attach a UUID if one isnt already present and if it is present then propagate it. Unfortunately, this sort of logic is tedious and hard to get right as requests move from one node to another, synchronously and asynchrously, across thread and network boundaries. Spring Cloud Sleuth addresses this problem and provides an SPI into which backend distributed tracing systems, like OpenZipkin and Google Cloud Stack Driver, can plugin.
As with all GCP APIs, we must first enable this one.
gcloud services enable cloudtrace.googleapis.com
We’re going to setup a trivial REST API and a trivial REST client, and use the Spring Cloud GCP Stack Driver support to make short work of tracing those interactions.
Let’s first look at our trivial REST API. Start a new project (using the skeletal pom.xml from above) and add org.springframework.boot : spring-boot-starter-web and org.springframework.cloud : spring-cloud-gcp-starter-trace. Our REST API (well, endpoint, anyway) will return a "greetings, a name here!" whenever http://localhost:8080/greeting/{id}} is invoked. Here’s the code for the service, first:
package com.example.gcp.trace;

import org.springframework.boot.SpringApplication;
import org.springframework.boot.autoconfigure.SpringBootApplication;
import org.springframework.web.bind.annotation.GetMapping;
import org.springframework.web.bind.annotation.PathVariable;
import org.springframework.web.bind.annotation.RestController;

@RestController
@SpringBootApplication
public class TraceServiceApplication {

        @GetMapping("/greeting/{id}")
        String greet(@PathVariable String id) {
                return "greetings, " + id + "!";
        }

        public static void main(String args[]) {
                SpringApplication.run(TraceServiceApplication.class, args);
        }
}
The configuration is arguably more interesting.
src/main/resources/application.properties.
spring.cloud.gcp.trace.enabled=true


spring.sleuth.sampler.probability=1
spring.sleuth.web.skipPattern=(^cleanup.*|.+favicon.*)


server.port=8081


spring.application.name=trace-service
spring.application.name is our application’s logical name and it can be used in distinguishing it from other applications in trace trees, service registries, etc.The client lobs a hundred HTTP requests when the application starts up. The RestTemplate it uses has been post-processed by the Spring Cloud Sleuth auto-configuration to intercept and trace all HTTP calls.
package com.example.gcp.trace;

import lombok.extern.slf4j.Slf4j;
import org.springframework.boot.SpringApplication;
import org.springframework.boot.autoconfigure.SpringBootApplication;
import org.springframework.boot.context.event.ApplicationReadyEvent;
import org.springframework.cloud.sleuth.annotation.NewSpan;
import org.springframework.context.annotation.Bean;
import org.springframework.context.event.EventListener;
import org.springframework.stereotype.Component;
import org.springframework.web.client.RestTemplate;

import java.util.stream.IntStream;

@Slf4j
@SpringBootApplication
public class TraceClientApplication {

        @Component
        public static class Client {

                private final RestTemplate restTemplate;

                public Client(RestTemplate restTemplate) {
                        this.restTemplate = restTemplate;
                }

                @EventListener(ApplicationReadyEvent.class)
                @NewSpan("client")
                public void before() {
                        IntStream
                            .range(0, 100)
                            .mapToObj(i ->
                                restTemplate
                                    .getForEntity("http://localhost:8081/greeting/{id}", String.class, i)
                                    .getBody())
                            .forEach(response -> log.info("result: " + response));
                }
        }

        @Bean
        RestTemplate restTemplate() {
                return new RestTemplate();
        }

        public static void main(String args[]) {
                SpringApplication.run(TraceClientApplication.class, args);
        }
}
RestTemplate to connect to our service. If we wanted to send 100 requests with no shared parent span, we wouldn’t need @NewSpan. If we’d had 100 requests arrive from the outside and hit an HTTP endpoint in the client and that endpoint then resulted in 100 requests going to the service, we’d have a shared overarching span. A single trace with multiple spans.And the configuration for this node is virtually identical to that of the service.
spring.cloud.gcp.trace.enabled=true

spring.sleuth.sampler.probability=1
spring.sleuth.web.skipPattern=(^cleanup.*|.+favicon.*)

spring.application.name=trace-client

server.port=8080
In order to see this in action, you’ll need to start the service, then the client, and then make your way over to the Google Cloud Console. Click on the "Hamburger"menu on the left hand side of the screen and click on STACKDRIVER → TRACE. There you’ll be given the ability to inspect the requests that just flew through your services.
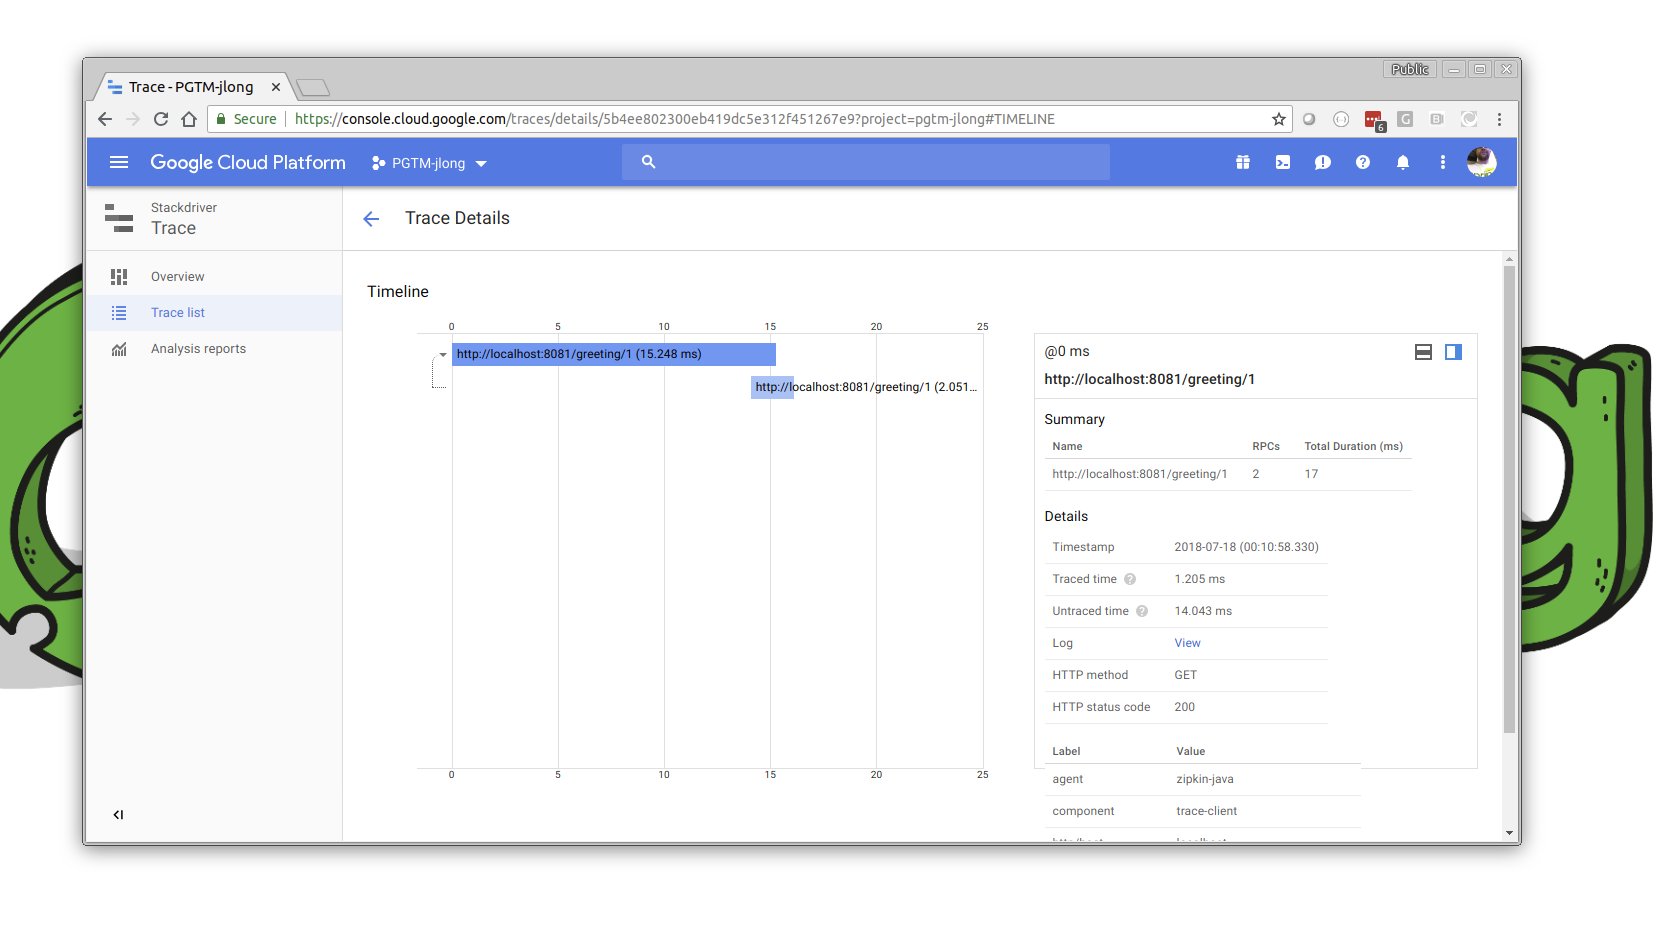
Stackdriver is the umbrella name for a host of services including monitoring, tracing, and - and this is so wicked cool! - live debugging of running applications. You could easily spend a lot more time - you should! - in this section of the console. Suffice it to say that Google is gets observability and that’s reflected in their services.

VMware offers training and certification to turbo-charge your progress.
Learn moreTanzu Spring offers support and binaries for OpenJDK™, Spring, and Apache Tomcat® in one simple subscription.
Learn moreCheck out all the upcoming events in the Spring community.
View all