<dependency>
  <groupId>com.wavefront</groupId>
  <artifactId>wavefront-spring-boot-starter</artifactId>
  <version>3.0.1</version>
</dependency>
Observability with Spring
This guide walks you through your first Spring Boot project with Tanzu Observability by Wavefront.
What You Will Build
You will create a simple web application and configure it to send metrics to a freemium cluster.
What You need
-
About 15 minutes
-
A favorite text editor or IDE
-
Java 17 or later
-
You can also import the code straight into your IDE:
How to complete this guide
Like most Spring Getting Started guides, you can start from scratch and complete each step or you can bypass basic setup steps that are already familiar to you. Either way, you end up with working code.
To start from scratch, move on to Starting with Spring Initializr.
To skip the basics, do the following:
-
Download and unzip the source repository for this guide, or clone it using Git:
git clone https://github.com/spring-guides/gs-tanzu-observability.git -
cd into
gs-tanzu-observability/initial -
Jump ahead to Out-of-the-Box Observability.
When you finish, you can check your results against the code in gs-tanzu-observability/complete.
Starting with Spring Initializr
You can use this pre-initialized project and click Generate to download a ZIP file. This project is configured to fit the examples in this tutorial.
If you want to initialize the project manually, follow the steps given below:
-
Navigate to https://start.spring.io. This service pulls in all the dependencies you need for an application and does most of the setup for you.
-
Select your favorite build system and language. This guide assumes you’ve selected Java and Maven.
-
Click Add dependencies and select Spring Web and then Wavefront.
-
Click Generate. You download a ZIP file, which is an archive of a web application that includes Tanzu Observability.
| If your IDE has the Spring Initializr integration, you can complete the steps above from your IDE. |
Out-of-the-Box Observability
Follow these steps to start the project and to automatically send several auto-configured metrics to Tanzu Observability by Wavefront.
-
Add the Wavefront for Spring Boot 3 starter to the Maven dependencies. Open the
pom.xmland add the following to the<dependencies>block: -
Before you start the service, configure the project so that you can identify the metrics sent by the application and service. Open the
application.propertiesfile and add the following:management.wavefront.application.name=demo management.wavefront.application.service-name=getting-started
The properties above configure the integration to send metrics to Tanzu Observability by Wavefront using the demoapplication and thegetting-startedservice. An application can consist of an arbitrary number of microservices. -
Run the application from your IDE by invoking the
mainmethod ofDemoApplication. You see the following:INFO 58371 --- [ main] o.s.b.a.e.web.EndpointLinksResolver : Exposing 1 endpoint(s) beneath base path '/actuator' INFO 58371 --- [ main] o.s.b.w.embedded.tomcat.TomcatWebServer : Tomcat started on port(s): 8080 (http) with context path '' INFO 58371 --- [ main] hello.DemoApplication : Started DemoApplication in 1.705 seconds (process running for 2.038) A Wavefront account has been provisioned successfully and the API token has been saved to disk. To share this account, make sure the following is added to your configuration: management.wavefront.api-token=ee1f454b-abcd-efgh-1234-bb449f6a25ed management.wavefront.uri=https://wavefront.surf Connect to your Wavefront dashboard using this one-time use link: https://wavefront.surf/us/AtoKen
What Happened?
-
Without any extra information, an account on a Freemium cluster was automatically provisioned for you.
-
An API token was created for you.
-
To let you access your dashboard on the Freemium cluster, a one-time use link was logged when the application started. The link starts with
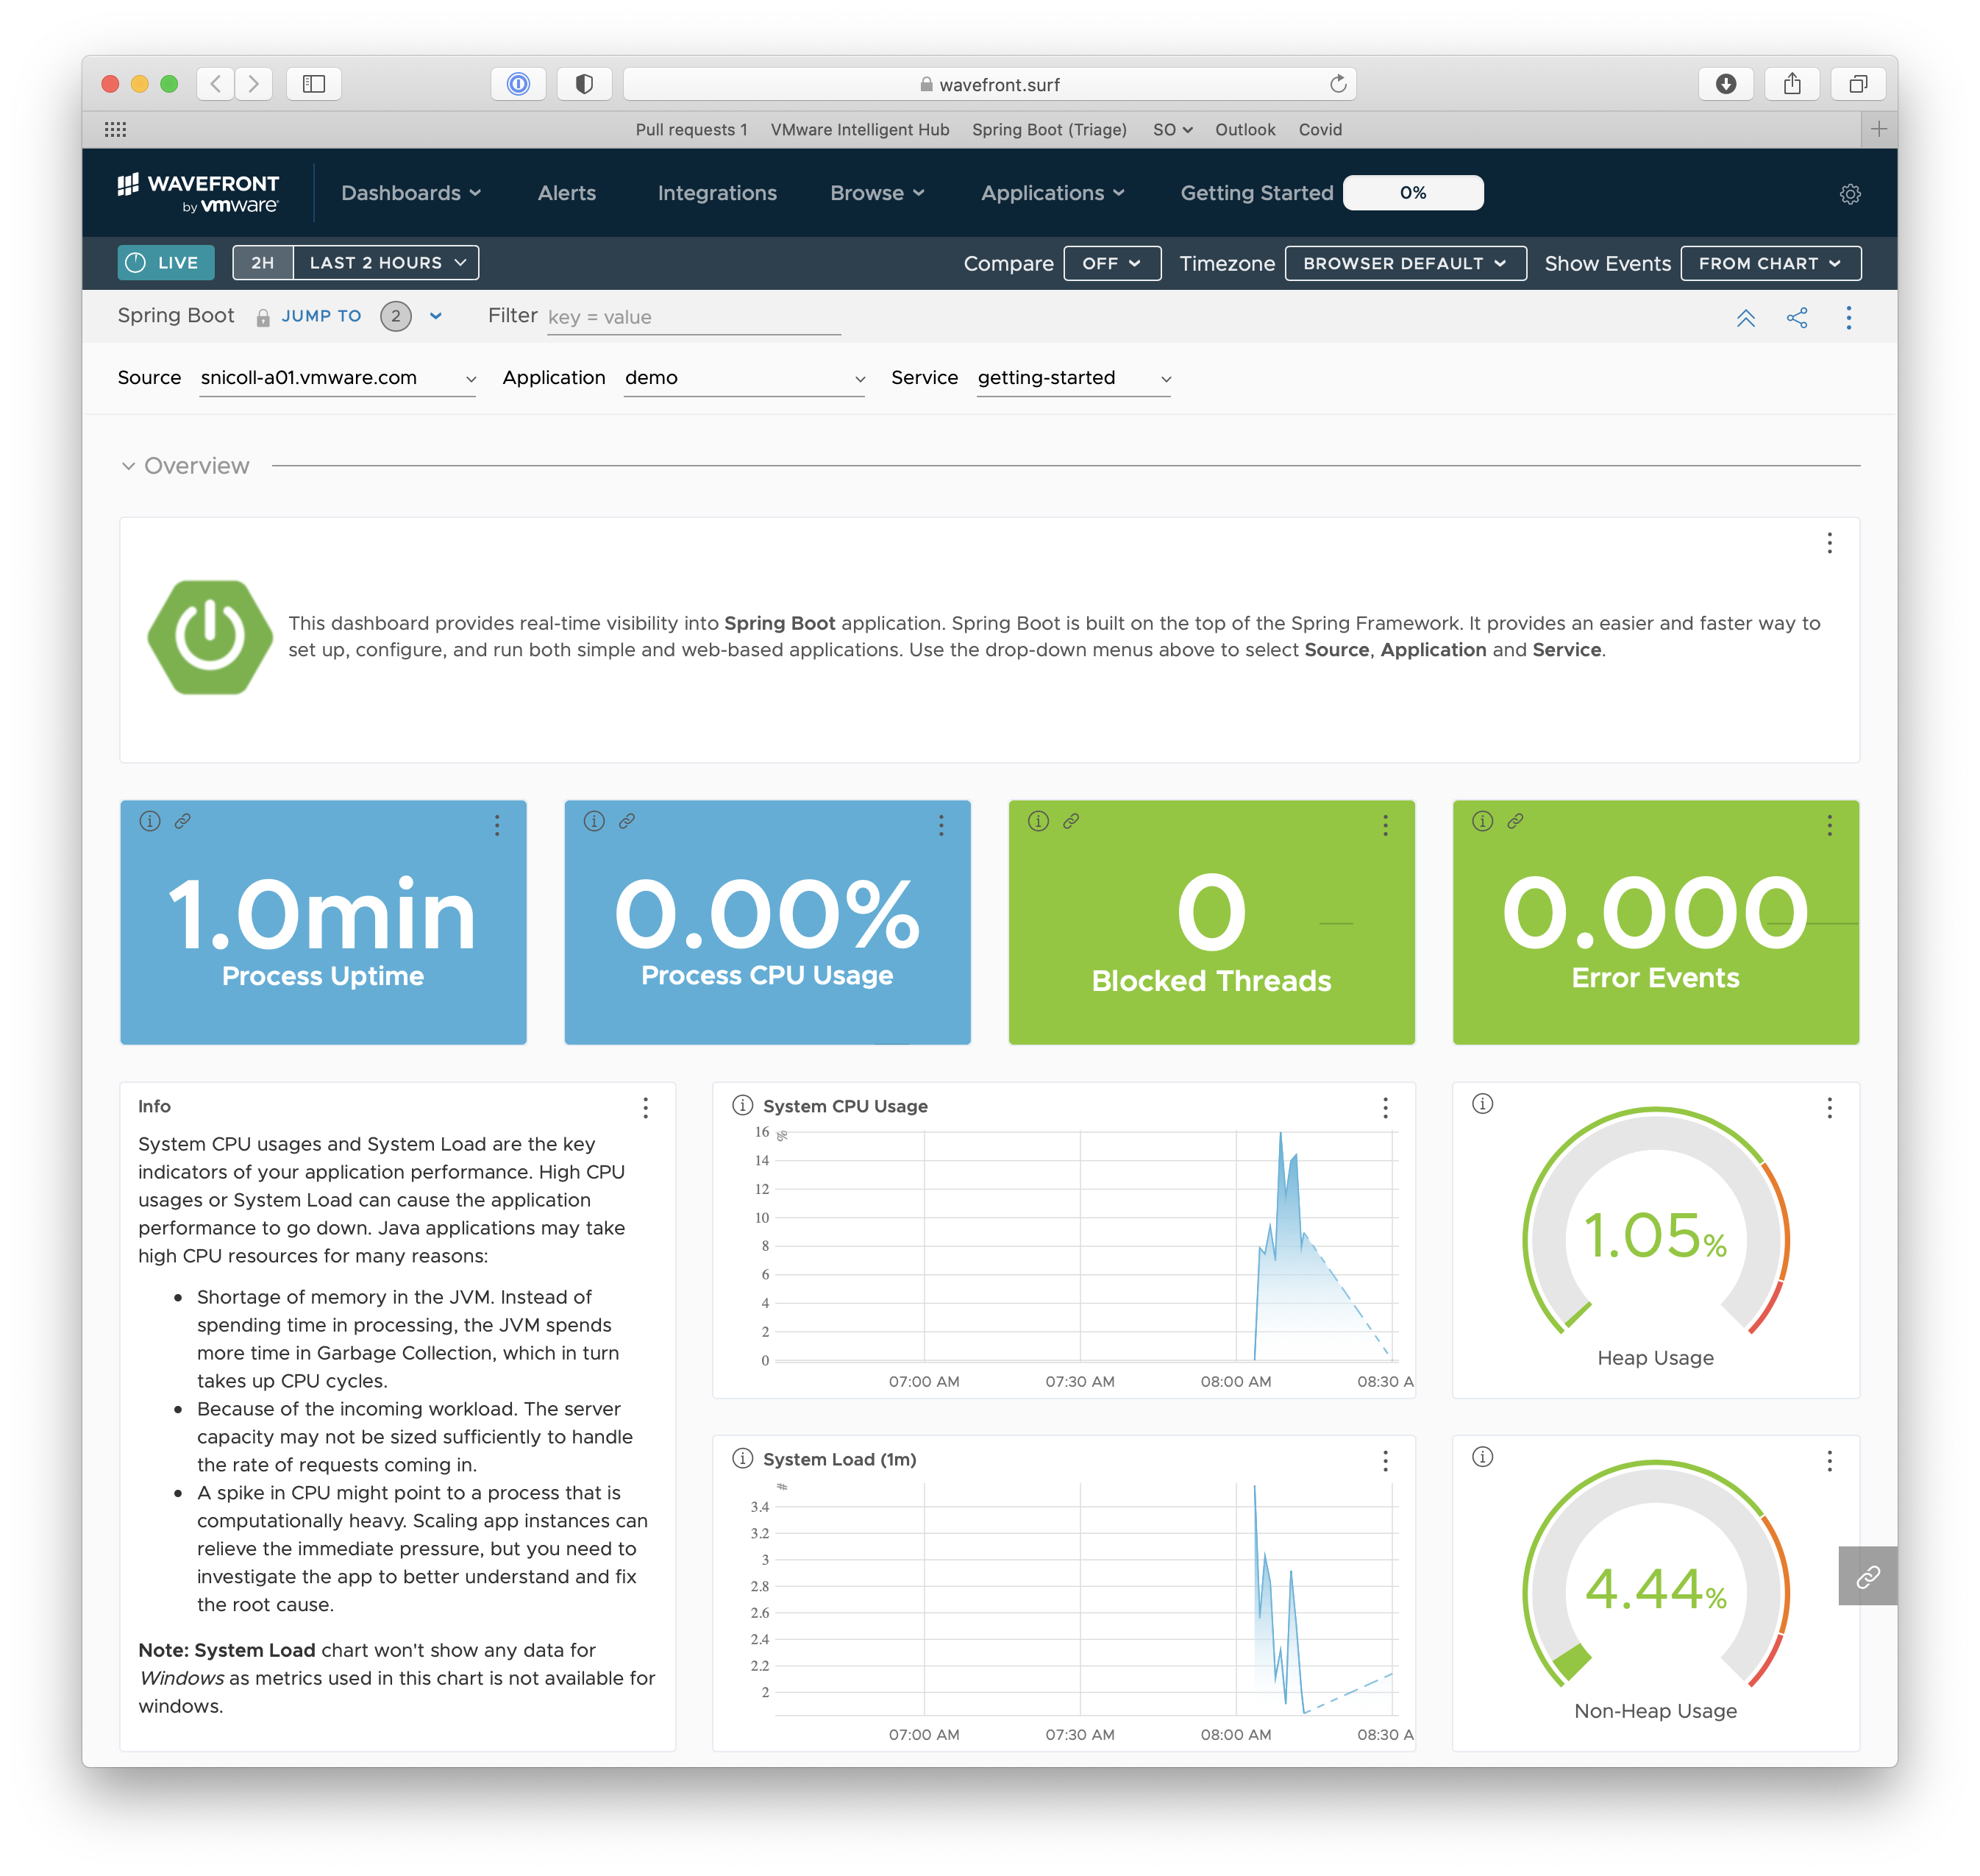
https://wavefront.surf. Copy this link into your favorite browser and explore the out-of-the-box Spring Boot dashboard:

|
It takes a minute for the data to show up. When you can see the data in Tanzu Observability by Wavefront, make sure that the Application and Service names in the filters match what you configured in the 
|
Create a Simple Controller
Next, you can create a simple controller to see how HTTP traffic is automatically instrumented. The following listing shows how to do so:
package hello;

import org.springframework.web.bind.annotation.GetMapping;
import org.springframework.web.bind.annotation.RestController;

@RestController
public class DemoController {

  @GetMapping("/")
  public String home() {
    return "Hello World";
  }

}-
Restart the application and trigger
http://localhost:8080from your browser multiple times. -
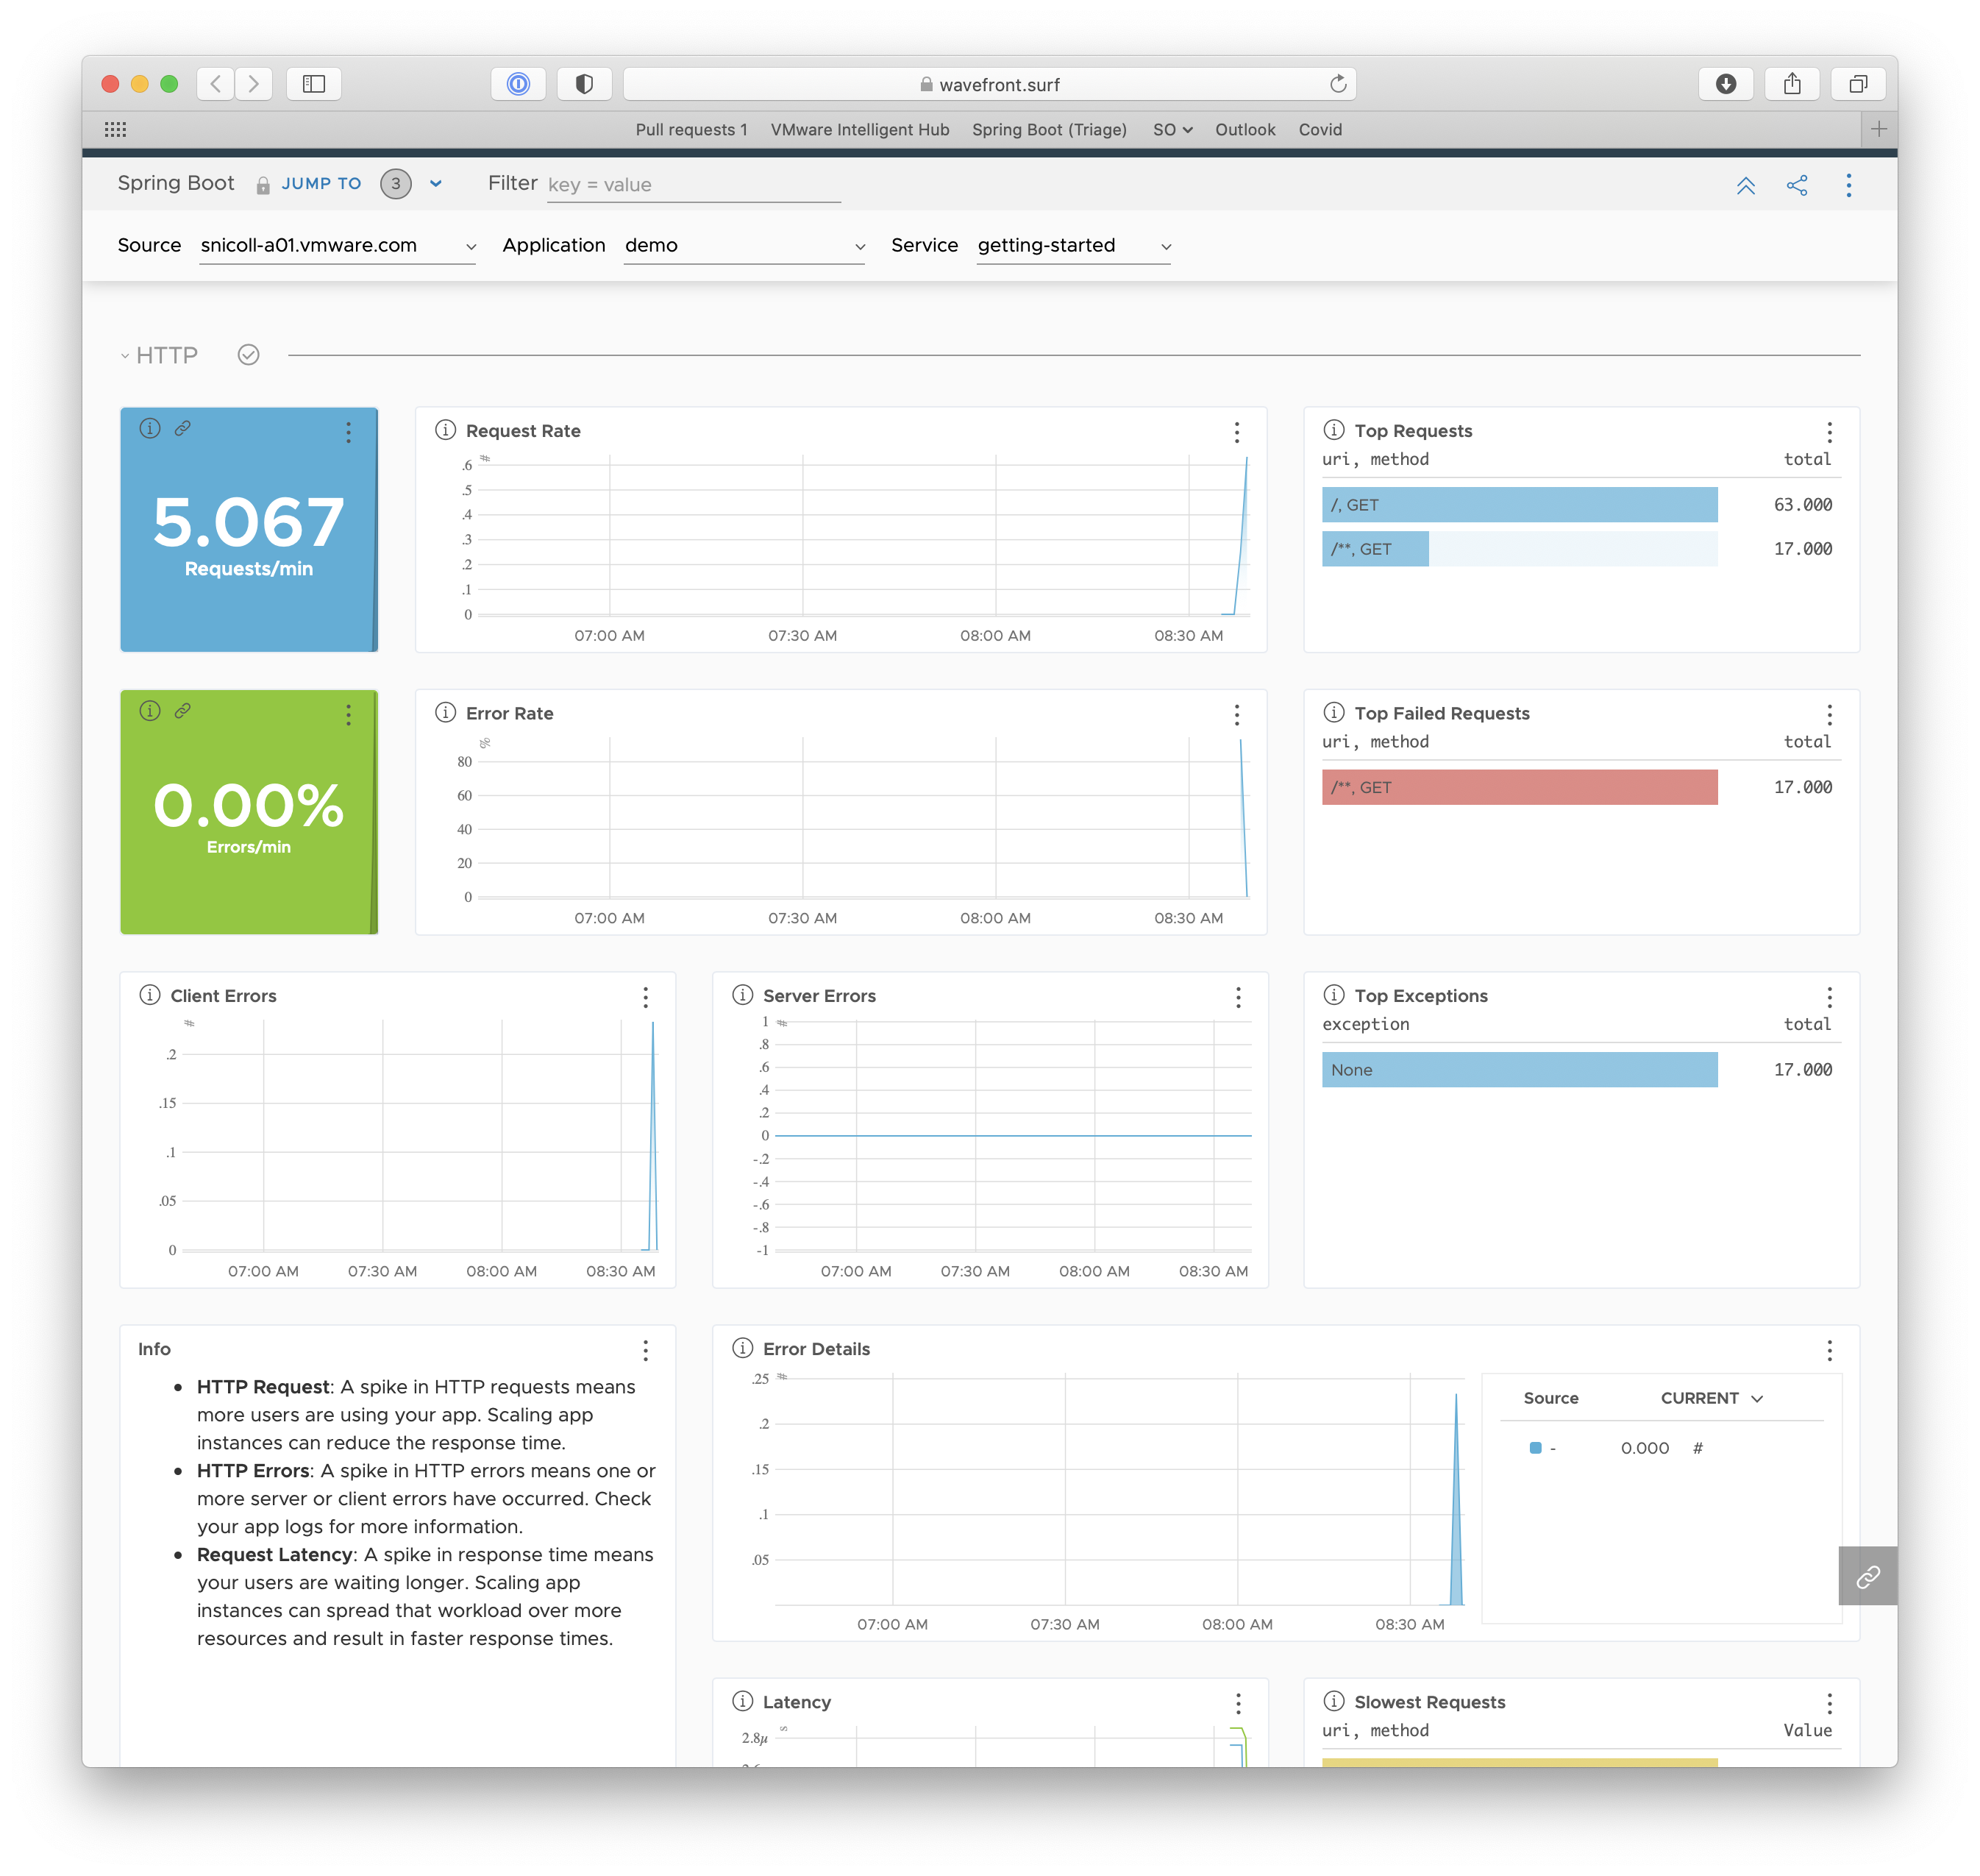
You’ll notice an extra HTTP section on the dashboard. This feature is called conditional dashboards and lets you display sections according to a filter.

-
Optionally, access
http://localhost:8080/does-not-existto trigger a client-side 404 error.
Summary
Congratulations! You just developed a web application that sends metrics to Tanzu Observability by Wavefront.
See Also
The following may also be helpful:
-
Wavefront for Spring Boot 3 README, which includes instructions for enabling Distributed Tracing
-
Tanzu Observability by Wavefront for Spring Boot Documentation
Want to write a new guide or contribute to an existing one? Check out our contribution guidelines.
| All guides are released with an ASLv2 license for the code, and an Attribution, NoDerivatives creative commons license for the writing. |