<?xml version="1.0" encoding="UTF-8"?>
<project xmlns="http://maven.apache.org/POM/4.0.0" xmlns:xsi="http://www.w3.org/2001/XMLSchema-instance"
         xsi:schemaLocation="http://maven.apache.org/POM/4.0.0 https://maven.apache.org/xsd/maven-4.0.0.xsd">
    <modelVersion>4.0.0</modelVersion>
    <parent>
        <groupId>org.springframework.boot</groupId>
        <artifactId>spring-boot-starter-parent</artifactId>
        <version>2.4.2</version>
        <relativePath/> <!-- lookup parent from repository -->
    </parent>
    <groupId>
        shakuzen.basics
    </groupId>
    <artifactId>root</artifactId>
    <version>0.0.1-SNAPSHOT</version>
    <packaging>pom</packaging>

    <modules>
    	<module>client</module>
    	<module>service</module>
    </modules>
</project>Metrics and Tracing with Spring
Spring offers the pieces you need to add metrics and tracing to your Spring applications. This tutorial walks through how to create such an application.
| You can find all the code for this tutorial in the Spring Metrics and Tracing tutorial repository. |
| This tutorial is based on a blog post by Tommy Ludwig and Josh Long. |
Setting up the Project
For this example, we need two applications. We call the first one service and the second one client. Consequently, we need a parent build file that builds both applications:
Creating the Service Application
To start creating the service application, visit start.spring.io, choose Maven and Java 15, and set the Artifact field to service. (You could use Gradle or Java 8 or Java 11, but this tutorial uses Maven and Java 8.) Then add the following dependencies:
Spring Reactive Web
Spring Boot Actuator
Lombok
Sleuth
Wavefront
The following link sets all those options: start.spring.io.
These settings generate the following pom.xml file:
<?xml version="1.0" encoding="UTF-8"?>
<project xmlns="http://maven.apache.org/POM/4.0.0" xmlns:xsi="http://www.w3.org/2001/XMLSchema-instance"
	xsi:schemaLocation="http://maven.apache.org/POM/4.0.0 https://maven.apache.org/xsd/maven-4.0.0.xsd">
	<modelVersion>4.0.0</modelVersion>
	<parent>
		<groupId>org.springframework.boot</groupId>
		<artifactId>spring-boot-starter-parent</artifactId>
		<version>2.4.3</version>
		<relativePath/> <!-- lookup parent from repository -->
	</parent>
	<groupId>com.example</groupId>
	<artifactId>service</artifactId>
	<version>0.0.1-SNAPSHOT</version>
	<name>service</name>
	<description>Demo project for Spring Boot</description>
	<properties>
		<java.version>15</java.version>
		<spring-cloud.version>2020.0.1</spring-cloud.version>
		<wavefront.version>2.1.0</wavefront.version>
	</properties>
	<dependencies>
		<dependency>
			<groupId>org.springframework.boot</groupId>
			<artifactId>spring-boot-starter-actuator</artifactId>
		</dependency>
		<dependency>
			<groupId>org.springframework.boot</groupId>
			<artifactId>spring-boot-starter-webflux</artifactId>
		</dependency>
		<dependency>
			<groupId>com.wavefront</groupId>
			<artifactId>wavefront-spring-boot-starter</artifactId>
		</dependency>
		<dependency>
			<groupId>org.springframework.cloud</groupId>
			<artifactId>spring-cloud-starter-sleuth</artifactId>
		</dependency>

		<dependency>
			<groupId>org.projectlombok</groupId>
			<artifactId>lombok</artifactId>
			<optional>true</optional>
		</dependency>
		<dependency>
			<groupId>org.springframework.boot</groupId>
			<artifactId>spring-boot-starter-test</artifactId>
			<scope>test</scope>
		</dependency>
		<dependency>
			<groupId>io.projectreactor</groupId>
			<artifactId>reactor-test</artifactId>
			<scope>test</scope>
		</dependency>
	</dependencies>
	<dependencyManagement>
		<dependencies>
			<dependency>
				<groupId>org.springframework.cloud</groupId>
				<artifactId>spring-cloud-dependencies</artifactId>
				<version>${spring-cloud.version}</version>
				<type>pom</type>
				<scope>import</scope>
			</dependency>
			<dependency>
				<groupId>com.wavefront</groupId>
				<artifactId>wavefront-spring-boot-bom</artifactId>
				<version>${wavefront.version}</version>
				<type>pom</type>
				<scope>import</scope>
			</dependency>
		</dependencies>
	</dependencyManagement>

	<build>
		<plugins>
			<plugin>
				<groupId>org.springframework.boot</groupId>
				<artifactId>spring-boot-maven-plugin</artifactId>
				<configuration>
					<excludes>
						<exclude>
							<groupId>org.projectlombok</groupId>
							<artifactId>lombok</artifactId>
						</exclude>
					</excludes>
				</configuration>
			</plugin>
		</plugins>
	</build>

</project>
The service application needs to have some application properties set. In particular, we need to set the port to 8083 and set the application name to service. (We explain the other two settings as they become relevant.) Consequently, we need the following application.properties file:
spring.application.name=service
server.port=8083
wavefront.application.name=console-availability
management.metrics.export.wavefront.source=my-cloud-server
Now we can write that actual application:
package server;

import lombok.extern.slf4j.Slf4j;
import org.springframework.boot.SpringApplication;
import org.springframework.boot.autoconfigure.SpringBootApplication;
import org.springframework.util.Assert;
import org.springframework.util.StringUtils;
import org.springframework.web.bind.annotation.GetMapping;
import org.springframework.web.bind.annotation.PathVariable;
import org.springframework.web.bind.annotation.RestController;

import java.util.Map;
import java.util.Set;

@Slf4j
@SpringBootApplication
public class ServiceApplication {

    public static void main(String[] args) {
        log.info("starting server");
        SpringApplication.run(ServiceApplication.class, args);
    }
}

@RestController
class AvailabilityController {

    private boolean validate(String console) {
        return StringUtils.hasText(console) &&
               Set.of("ps5", "ps4", "switch", "xbox").contains(console);
    }

    @GetMapping("/availability/{console}")
    Map<String, Object> getAvailability(@PathVariable String console) {
        return Map.of("console", console,
                "available", checkAvailability(console));
    }

    private boolean checkAvailability(String console) {
        Assert.state(validate(console), () -> "the console specified, " + console + ", is not valid.");
        return switch (console) {
            case "ps5" -> throw new RuntimeException("Service exception");
            case "xbox" -> true;
            default -> false;
        };
    }
}
Given a request for a particular type of console (PS5, Nintendo, Xbox, or PS4), the API returns the console’s availability (presumably sourced from local electronics outlets). So that we can demonstrate an error, PlayStation 5 is never available. Also, the service itself throws an error when someone inquires about the Playstation 5. We use this particular code path (asking about the availability of Playstation 5) to simulate an error.
We want as much information as possible about individual microservices and their interactions, and we most want that information when we try to find bugs in the system. This arrangement lets us see how tracing and metrics can work together to provide an observability posture that is superior to using either metrics or tracing alone.
Creating the Client Application
Now we need a client application to exercise the service application. We start by using start.spring.io to create the pom.xml file for the client application. We need the same settings and dependencies as the service application, but we change the artifact ID to client. The following link sets all those values: start.spring.io. The result is the following pom.xml file:
<?xml version="1.0" encoding="UTF-8"?>
<project xmlns="http://maven.apache.org/POM/4.0.0" xmlns:xsi="http://www.w3.org/2001/XMLSchema-instance"
	xsi:schemaLocation="http://maven.apache.org/POM/4.0.0 https://maven.apache.org/xsd/maven-4.0.0.xsd">
	<modelVersion>4.0.0</modelVersion>
	<parent>
		<groupId>org.springframework.boot</groupId>
		<artifactId>spring-boot-starter-parent</artifactId>
		<version>2.4.3</version>
		<relativePath/> <!-- lookup parent from repository -->
	</parent>
	<groupId>com.example</groupId>
	<artifactId>client</artifactId>
	<version>0.0.1-SNAPSHOT</version>
	<name>client</name>
	<description>Demo project for Spring Boot</description>
	<properties>
		<java.version>15</java.version>
		<spring-cloud.version>2020.0.1</spring-cloud.version>
		<wavefront.version>2.1.0</wavefront.version>
	</properties>
	<dependencies>
		<dependency>
			<groupId>org.springframework.boot</groupId>
			<artifactId>spring-boot-starter-actuator</artifactId>
		</dependency>
		<dependency>
			<groupId>org.springframework.boot</groupId>
			<artifactId>spring-boot-starter-webflux</artifactId>
		</dependency>
		<dependency>
			<groupId>com.wavefront</groupId>
			<artifactId>wavefront-spring-boot-starter</artifactId>
		</dependency>
		<dependency>
			<groupId>org.springframework.cloud</groupId>
			<artifactId>spring-cloud-starter-sleuth</artifactId>
		</dependency>

		<dependency>
			<groupId>org.projectlombok</groupId>
			<artifactId>lombok</artifactId>
			<optional>true</optional>
		</dependency>
		<dependency>
			<groupId>org.springframework.boot</groupId>
			<artifactId>spring-boot-starter-test</artifactId>
			<scope>test</scope>
		</dependency>
		<dependency>
			<groupId>io.projectreactor</groupId>
			<artifactId>reactor-test</artifactId>
			<scope>test</scope>
		</dependency>
	</dependencies>
	<dependencyManagement>
		<dependencies>
			<dependency>
				<groupId>org.springframework.cloud</groupId>
				<artifactId>spring-cloud-dependencies</artifactId>
				<version>${spring-cloud.version}</version>
				<type>pom</type>
				<scope>import</scope>
			</dependency>
			<dependency>
				<groupId>com.wavefront</groupId>
				<artifactId>wavefront-spring-boot-bom</artifactId>
				<version>${wavefront.version}</version>
				<type>pom</type>
				<scope>import</scope>
			</dependency>
		</dependencies>
	</dependencyManagement>

	<build>
		<plugins>
			<plugin>
				<groupId>org.springframework.boot</groupId>
				<artifactId>spring-boot-maven-plugin</artifactId>
				<configuration>
					<excludes>
						<exclude>
							<groupId>org.projectlombok</groupId>
							<artifactId>lombok</artifactId>
						</exclude>
					</excludes>
				</configuration>
			</plugin>
		</plugins>
	</build>

</project>
The client application needs a slightly different set of application properties, which we set in the application.properties file:
spring.application.name=client
wavefront.application.name=console-availability
management.metrics.export.wavefront.source=my-cloud-server
For the client, we need not set the port.
Now we can create the client application code:
package client;

import lombok.AllArgsConstructor;
import lombok.Data;
import lombok.NoArgsConstructor;
import lombok.RequiredArgsConstructor;
import lombok.extern.slf4j.Slf4j;
import org.springframework.boot.SpringApplication;
import org.springframework.boot.autoconfigure.SpringBootApplication;
import org.springframework.boot.context.event.ApplicationReadyEvent;
import org.springframework.context.ApplicationListener;
import org.springframework.context.annotation.Bean;
import org.springframework.stereotype.Component;
import org.springframework.web.reactive.function.client.WebClient;
import reactor.core.publisher.Flux;
import reactor.core.publisher.Mono;

import java.time.Duration;

@Slf4j
@SpringBootApplication
public class ClientApplication {

    public static void main(String[] args) {
        log.info("starting client");
        SpringApplication.run(ClientApplication.class, args);
    }

    @Bean
    WebClient webClient(WebClient.Builder builder) {
        return builder.build();
    }

    @Bean
    ApplicationListener<ApplicationReadyEvent> ready(AvailabilityClient client) {
        return applicationReadyEvent -> {
            for (var console : "ps5,xbox,ps4,switch".split(",")) {
                Flux.range(0, 20).delayElements(Duration.ofMillis(100)).subscribe(i ->
                        client
                                .checkAvailability(console)
                                .subscribe(availability ->
                                        log.info("console: {}, availability: {} ", console, availability.isAvailable())));
            }
        };
    }
}

@Data
@AllArgsConstructor
@NoArgsConstructor
class Availability {
    private boolean available;
    private String console;
}

@Component
@RequiredArgsConstructor
class AvailabilityClient {

    private final WebClient webClient;
    private static final String URI = "http://localhost:8083/availability/{console}";

    Mono<Availability> checkAvailability(String console) {
        return this.webClient
                .get()
                .uri(URI, console)
                .retrieve()
                .bodyToMono(Availability.class)
                .onErrorReturn(new Availability(false, console));
    }

}
The code uses the reactive, non-blocking WebClient to issue requests against the service. The entire application, both client and service, uses reactive, non-blocking HTTP. You could just as easily use the traditional servlet-based Spring MVC. You could also avoid HTTP altogether and use messaging technologies or some combination of those technologies.
Running the Applications
Now that we have both applications, we can run them. Start the service application. Note the Wavefront URL in the console output from the service application. Paste that URL into a web browser, so that you can see the Wavefront dashboard for the application. (You want to get that URL before you start the client application, as the client application intentionally creates a number of errors that create a lot of console output.)
Now you can start the client application. The client application generates data that, after a minute or so, appears in the Wavefront dashboard. As noted earlier, the client application also generates a number of errors, each with the following message: 500 Server Error for HTTP GET "/availability/ps5". Those errors let us model what happens when an application produces errors.
Understanding the Tools
As you saw when we created the applications, we included Spring Boot Actuator and Sleuth.
Spring Boot Actuator brings in Micrometer, which provides a simple facade over the instrumentation clients for the most popular monitoring systems, letting you instrument your JVM-based application code without vendor lock-in. Think “SLF4J for metrics”.
The most straightforward use of Micrometer is to capture metrics and keep them in memory, which Spring Boot Actuator does. You can configure your application to show those metrics under an Actuator management endpoint: /actuator/metrics/. More commonly, though, you want to send these metrics to a time-series database, such as Graphite, Prometheus, Netflix Atlas, Datadog, or InfluxDB. Time series databases store the evolving value of a metric over time, so you can see how it has changed.
We also want to have detailed breakdowns of individual requests and traces to give us context around particular failed requests. The Sleuth starter brings in the Spring Cloud Sleuth distributed tracing abstraction, which provides a simple facade over distributed tracing systems, such as OpenZipkin and Google Cloud Stackdriver Trace and Wavefront.
Micrometer and Sleuth give you the power of choice in metrics and tracing backends. We could use these two different abstractions and separately stand up a dedicated cluster for our tracing and metrics aggregation systems. Because these tools do not tie you to a particular vendor, they give you a lot of flexibility around how you build your tracing and metrics framework.
Using the Wavefront Dashboard
Now we can see what is happening to our application in Wavefront. Paste the Wavefront URL that you copied earlier into a browser.
| Wavefront has a lot of capabilities. We touch on only those capabilities that matter for this example. |
The URL is to a free demo account for Wavefront. It has a limited lifespan, so it cannot support a production application, but it works for a demonstration.
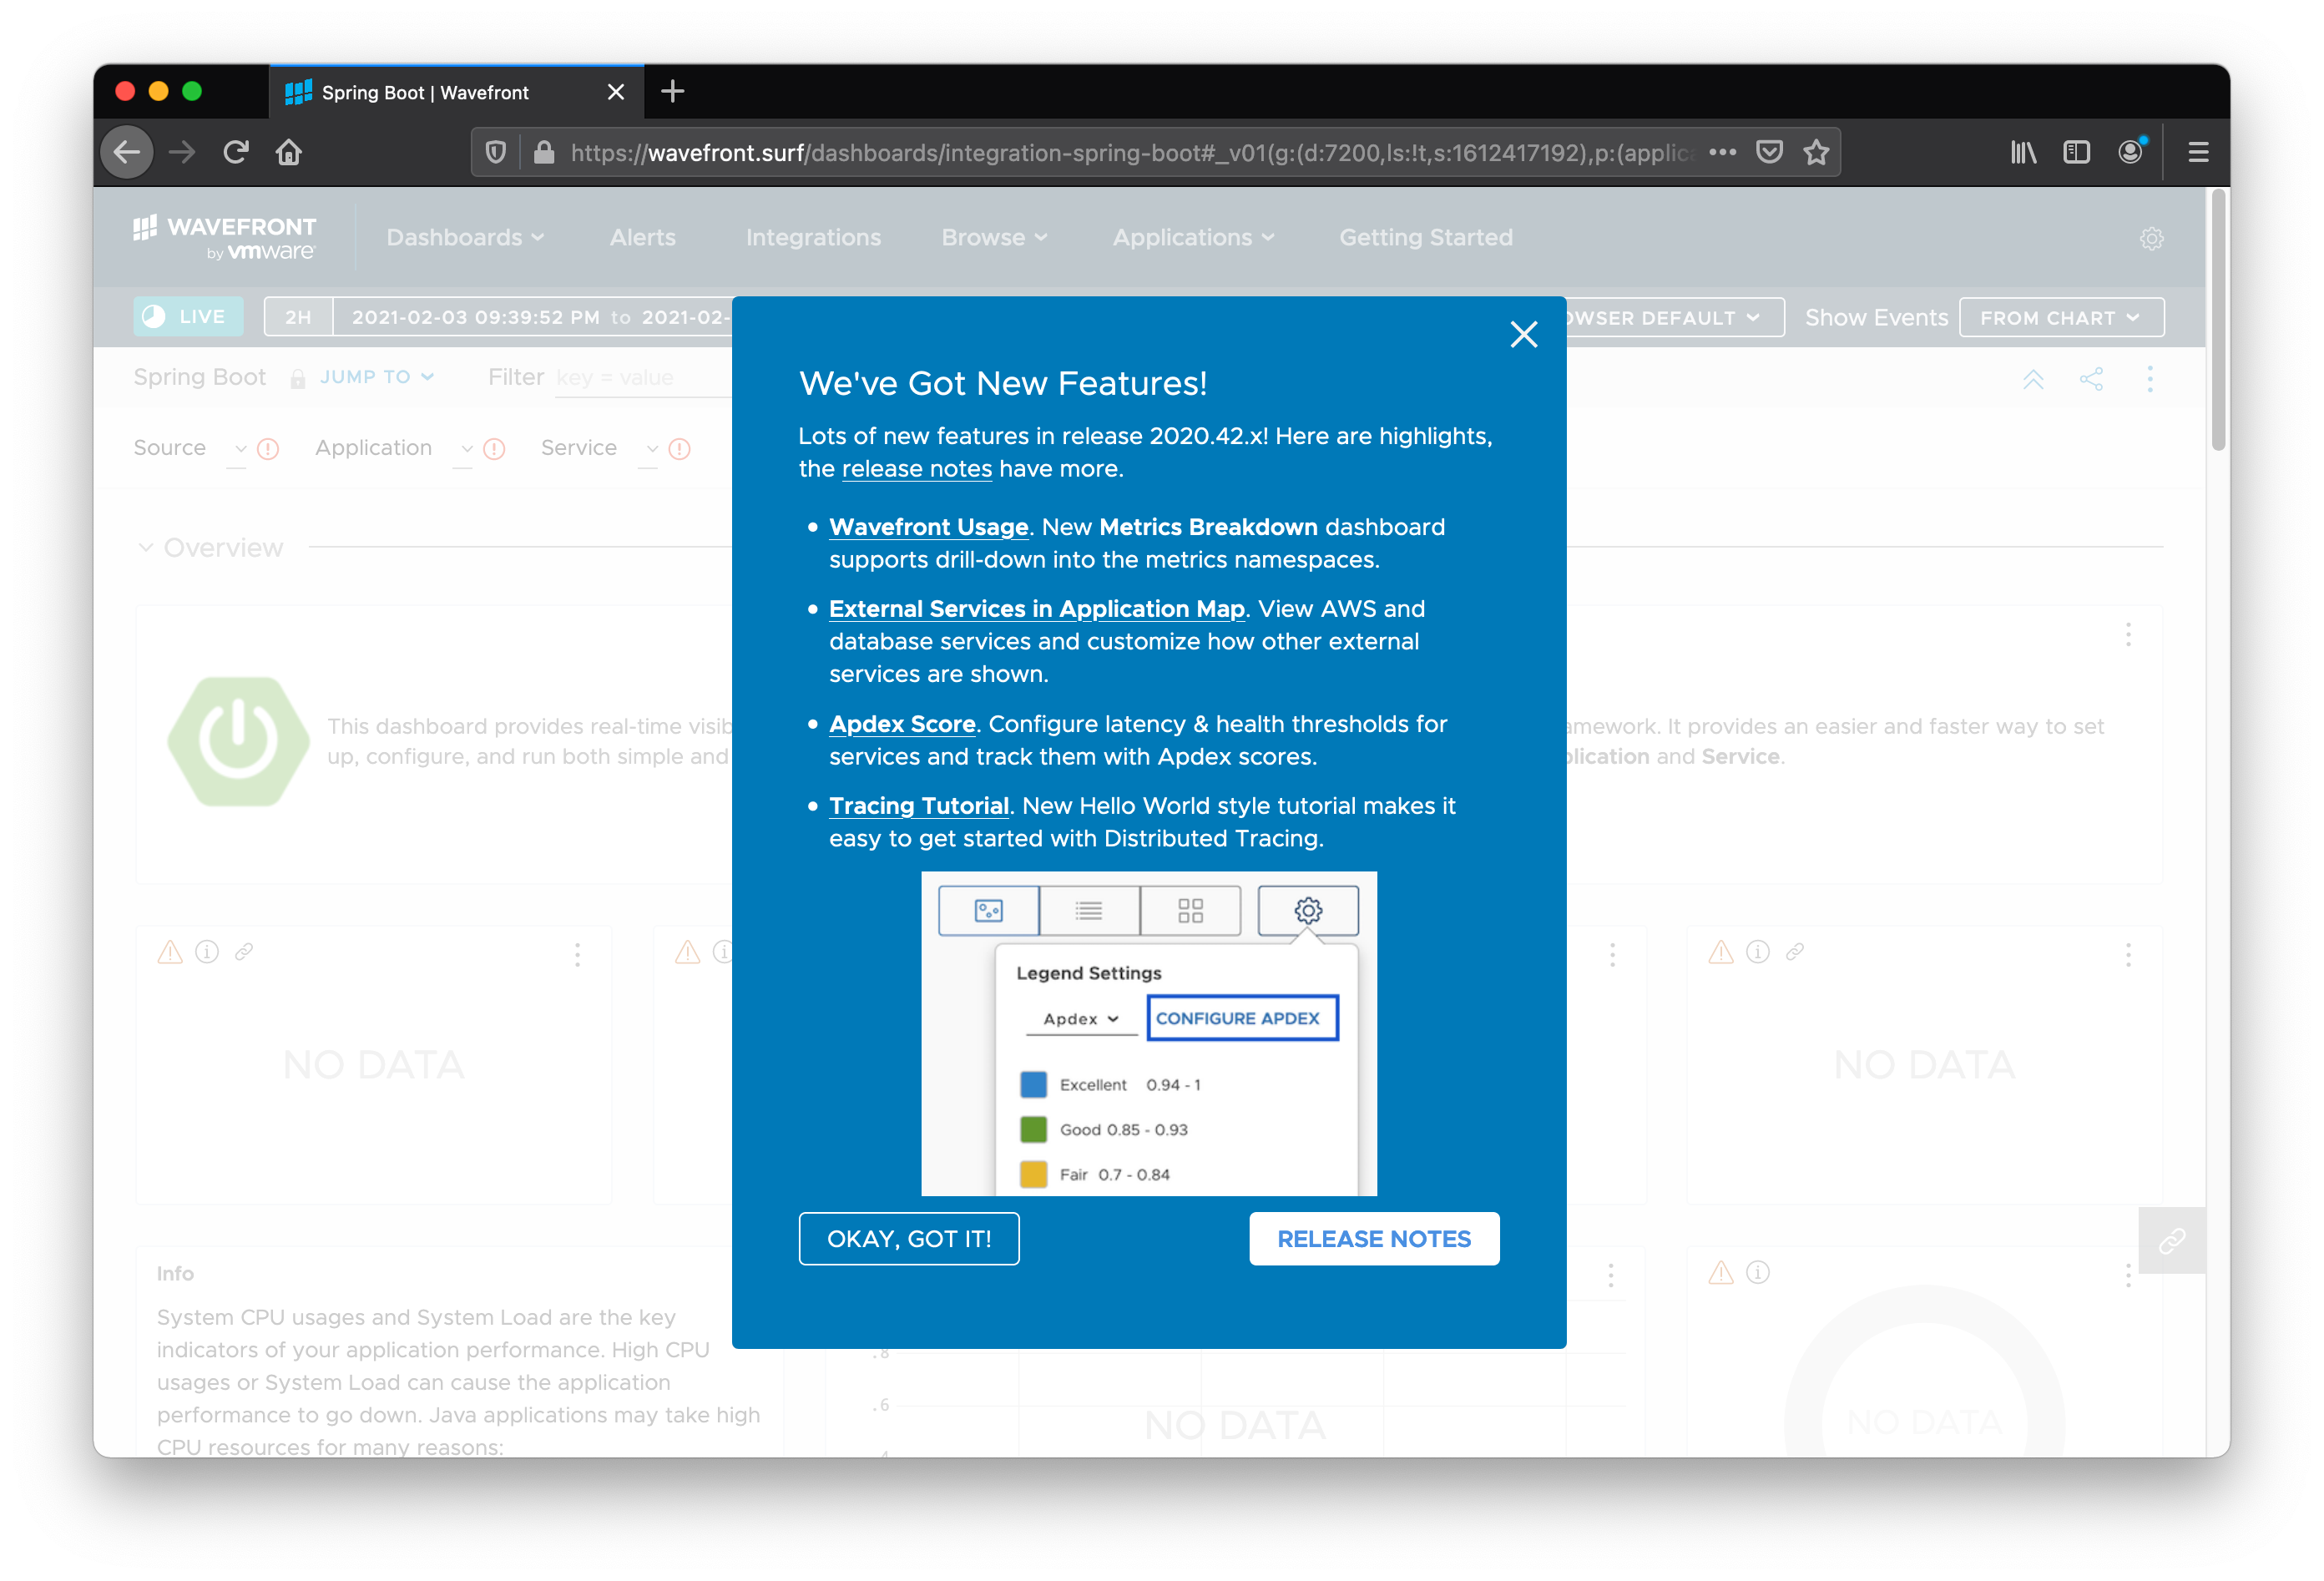
The following image shows the starting page of the Wavefront dashboard for our application:
Wavefront comes fully loaded with a Spring Boot dashboard in the Dashboards menu at the top of the screen. The top of the dashboard shows that the source is my-cloud-server, which comes from the management.export.wavefront.source configuration property (or you can use the default, which is the hostname of the machine). The application we care about is console-availability, which comes from the wavefront.application.name configuration property. “Application” refers to the logical group of Spring Boot microservices rather than any specific application.
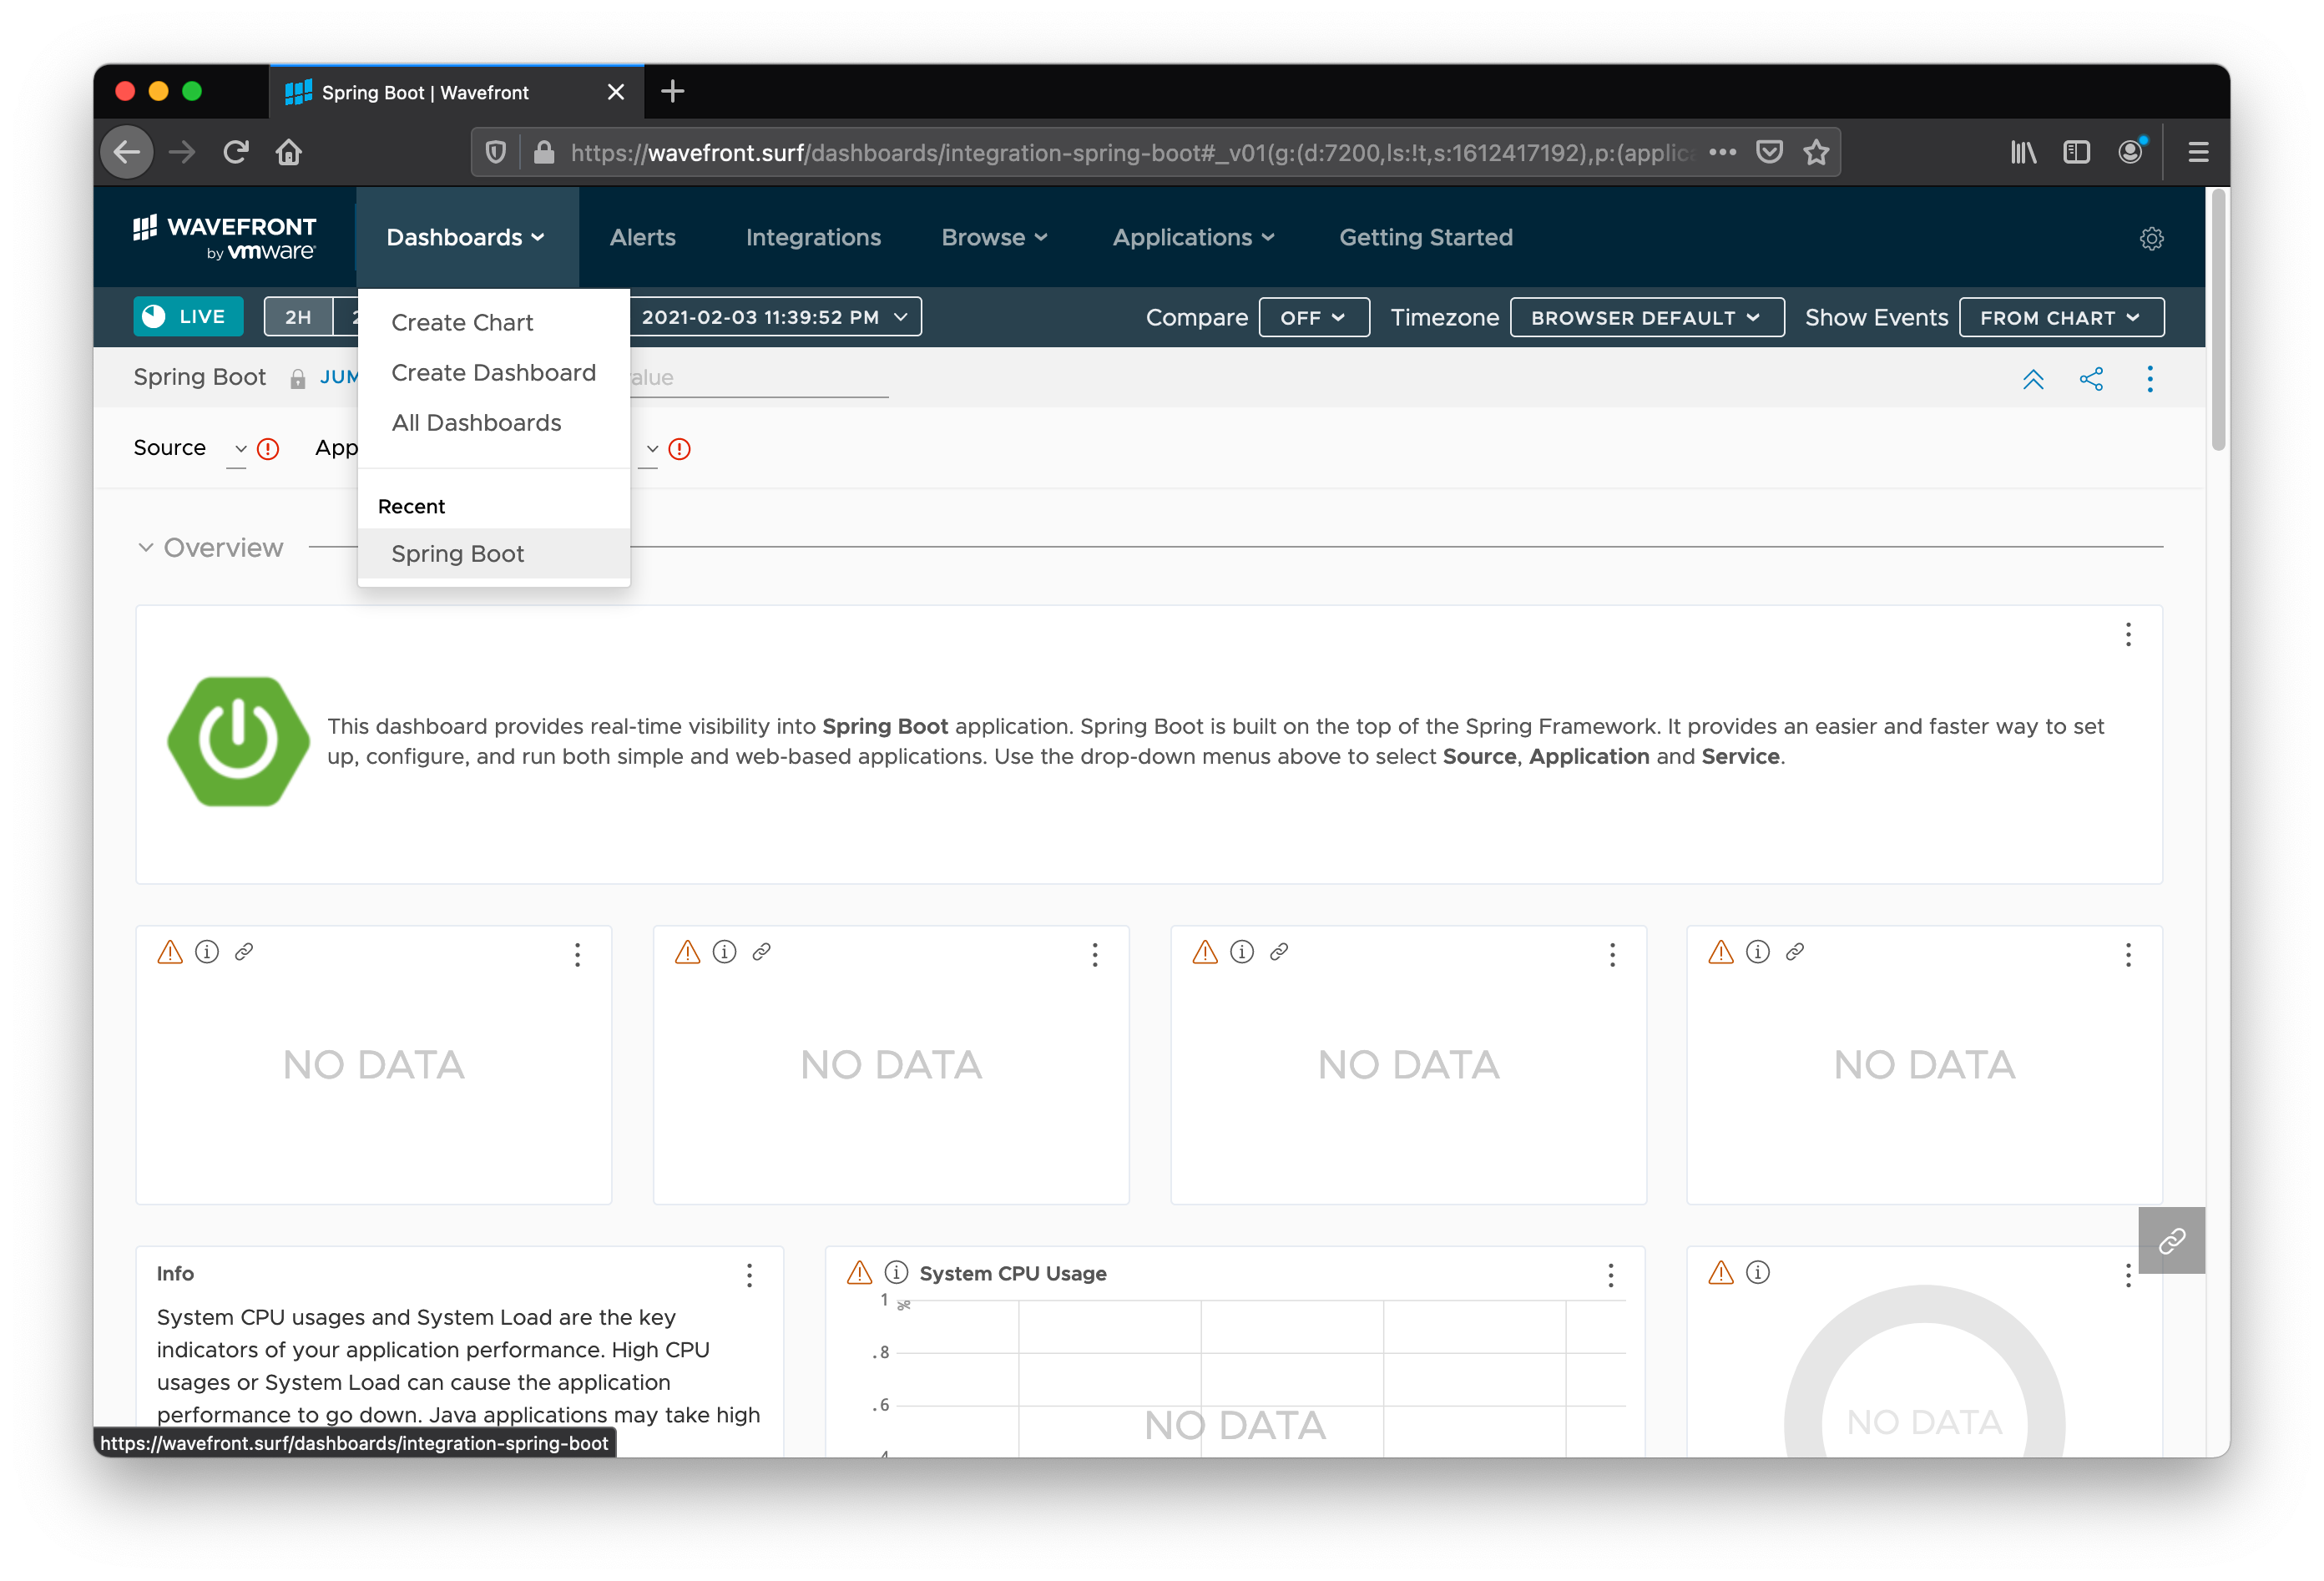
Click on console-availability to see everything about your application at a glance. You can look at information for either module: client or service. Click Jump To to navigate to a particular set of graphs. We want the data in the HTTP section.
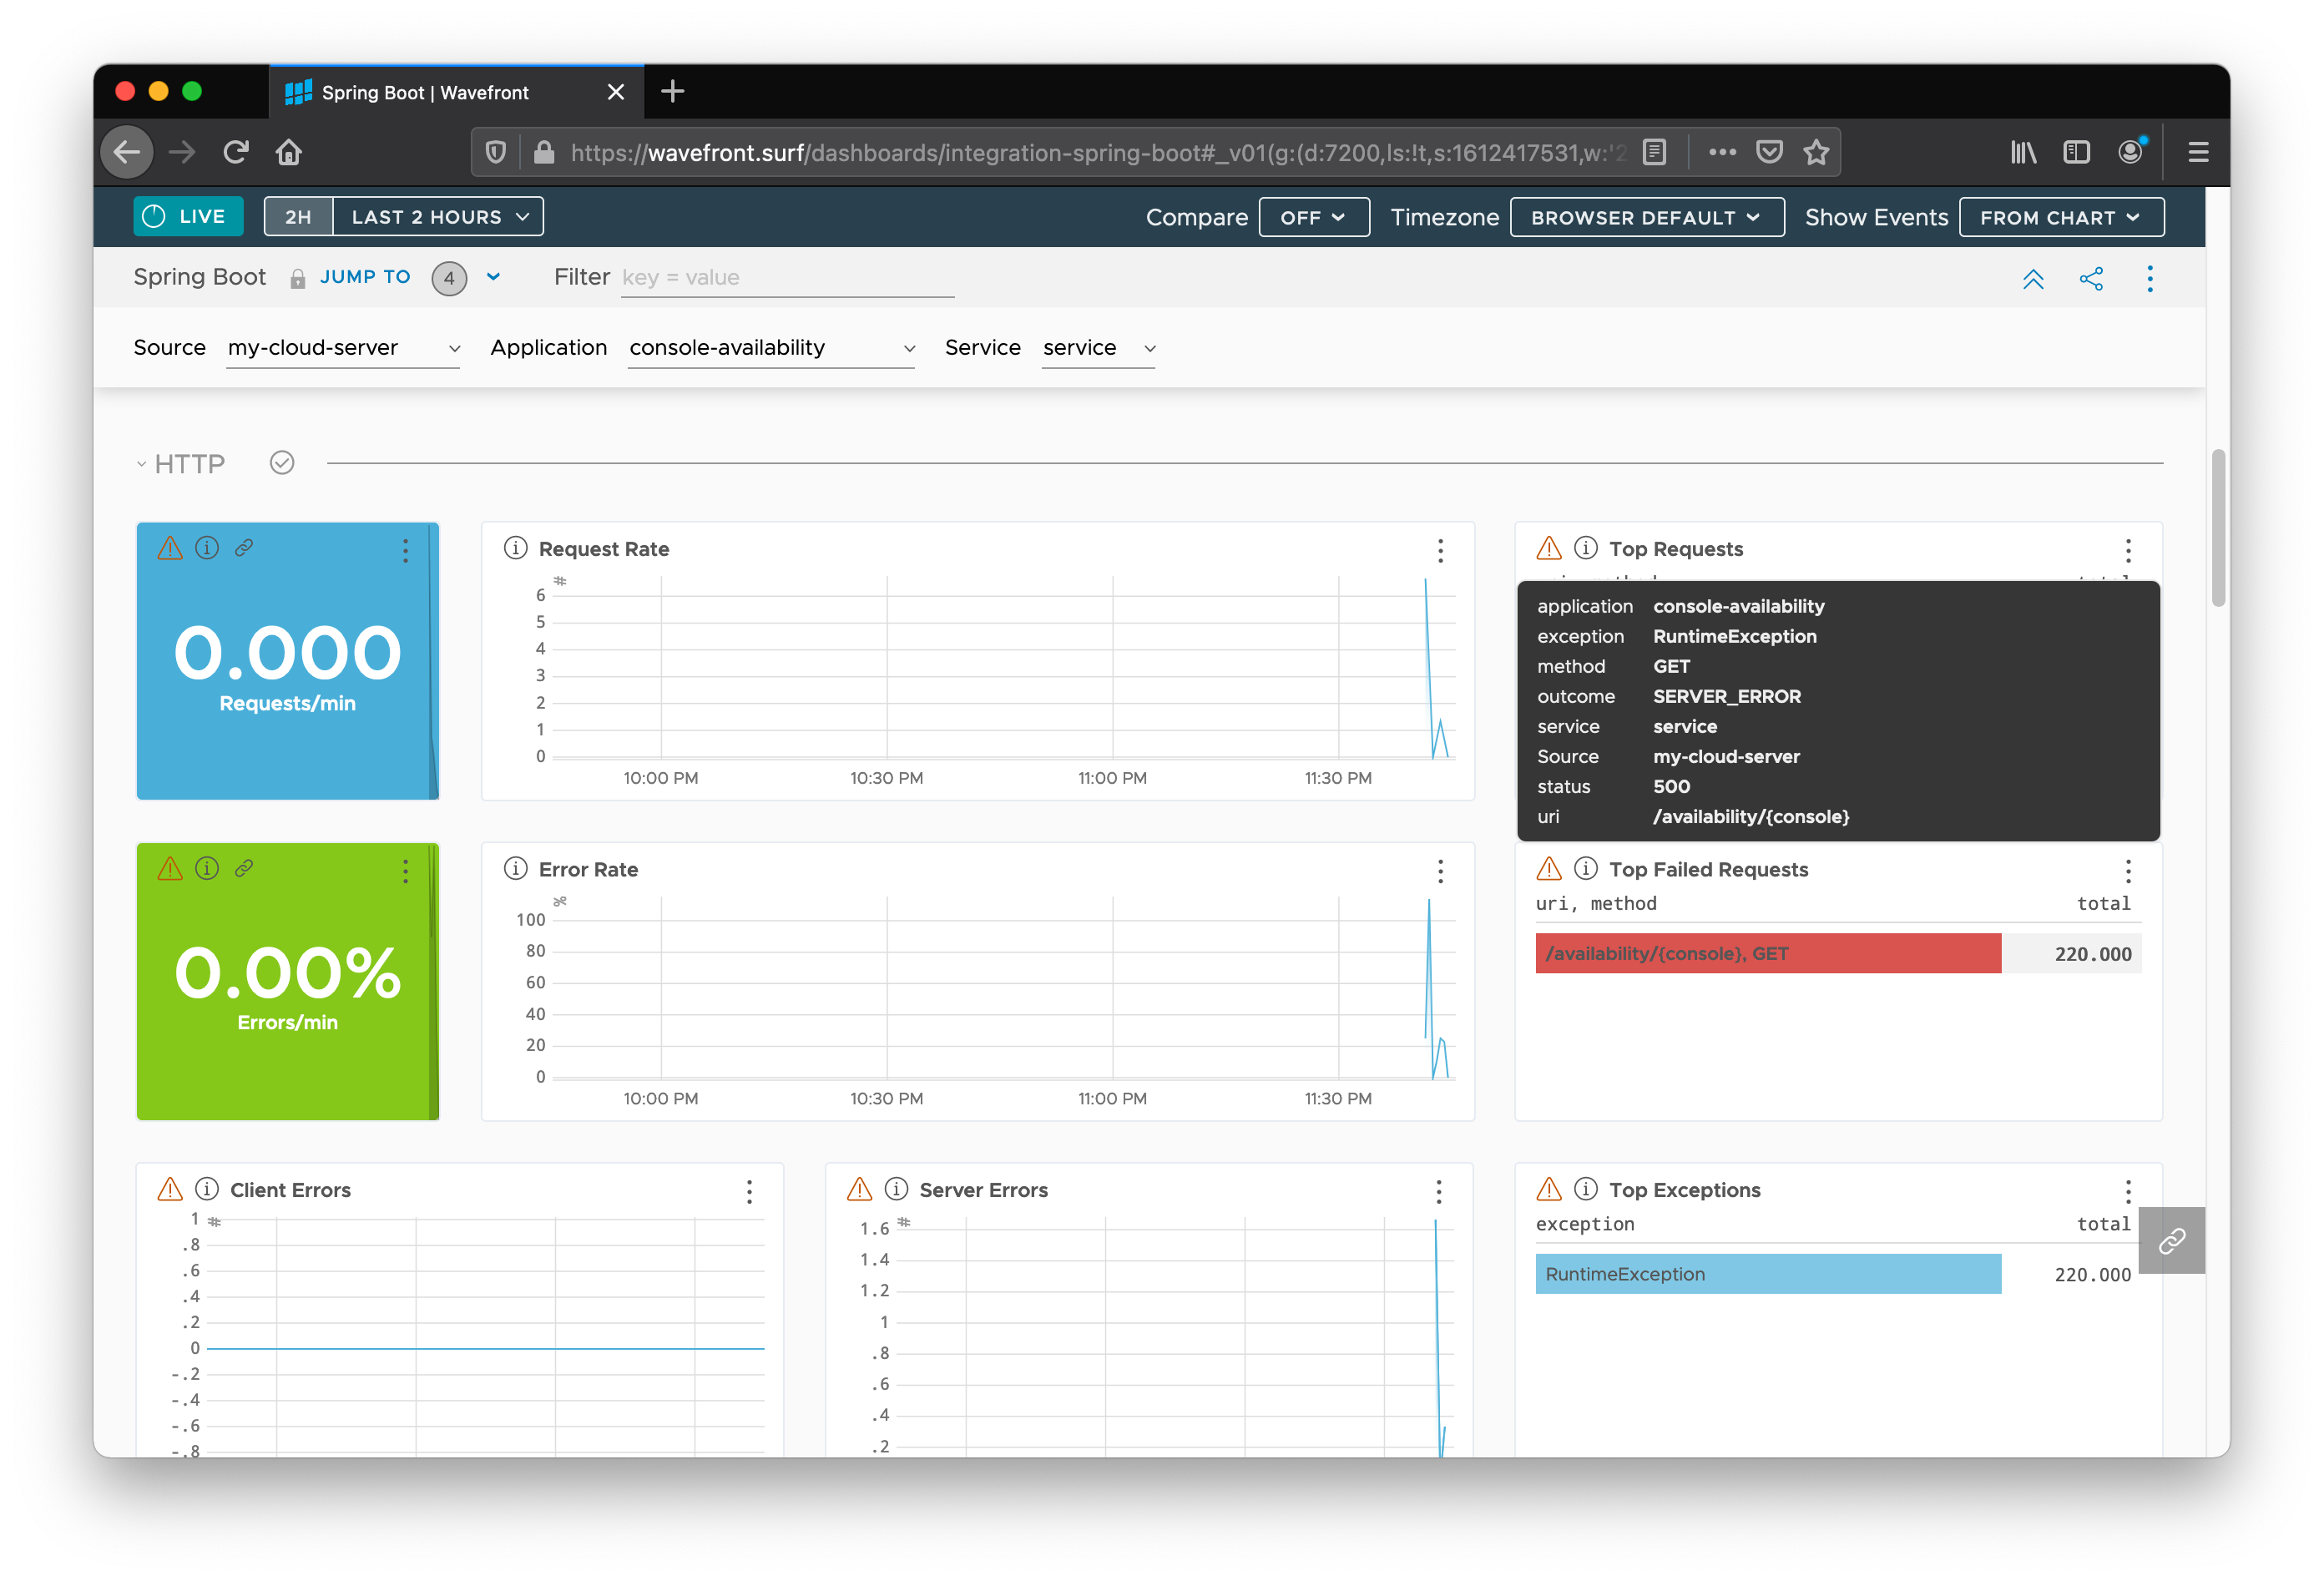
You can see useful information, such as the Top Requests, the Top Failed Requests, and the Top Exceptions encountered in the code. Mouse over a particular type of request to get some details associated with each entry. You can get information associated with the failing requests, such as the HTTP method (GET), service (service), status code (500), and URI (/availability/{console}).
These kinds of at-a-glance numbers are metrics. Metrics are not based on sampled data. They are an aggregation of every single request. You should use metrics for your alerting, because they ensure that you see all your requests (and all the errors, slow requests, and so on). Trace data, on the other hand, usually needs to be sampled at high volumes of traffic because the amount of data increases proportionally to the traffic volume.
We can see that the metrics collection has ignored the values for the {console} path variable in distinguishing the requests. This means that, as far as our data is concerned, there is only one URI: /availability/{console}. This is by design. {console} is a path variable that we use to specify the console, but it could just as easily have been a user ID, an order ID, or some other thing for which there are likely many, possibly unbounded, values. It would be dangerous for the metrics system to record high cardinality metrics by default. Bounded cardinality metrics are cheap. Cost does not increase with traffic. Watch for cardinality in your metrics.
It is a little unfortunate, because, even though we know that {console} is a low-cardinality variable (there is a finite set of possible values), we cannot drill down into the data any further to see at a glance which paths are failing. Metrics represent aggregated statistics, so, even if we broke down the metrics in terms of the {console} variable, the metrics still lack context around individual requests.
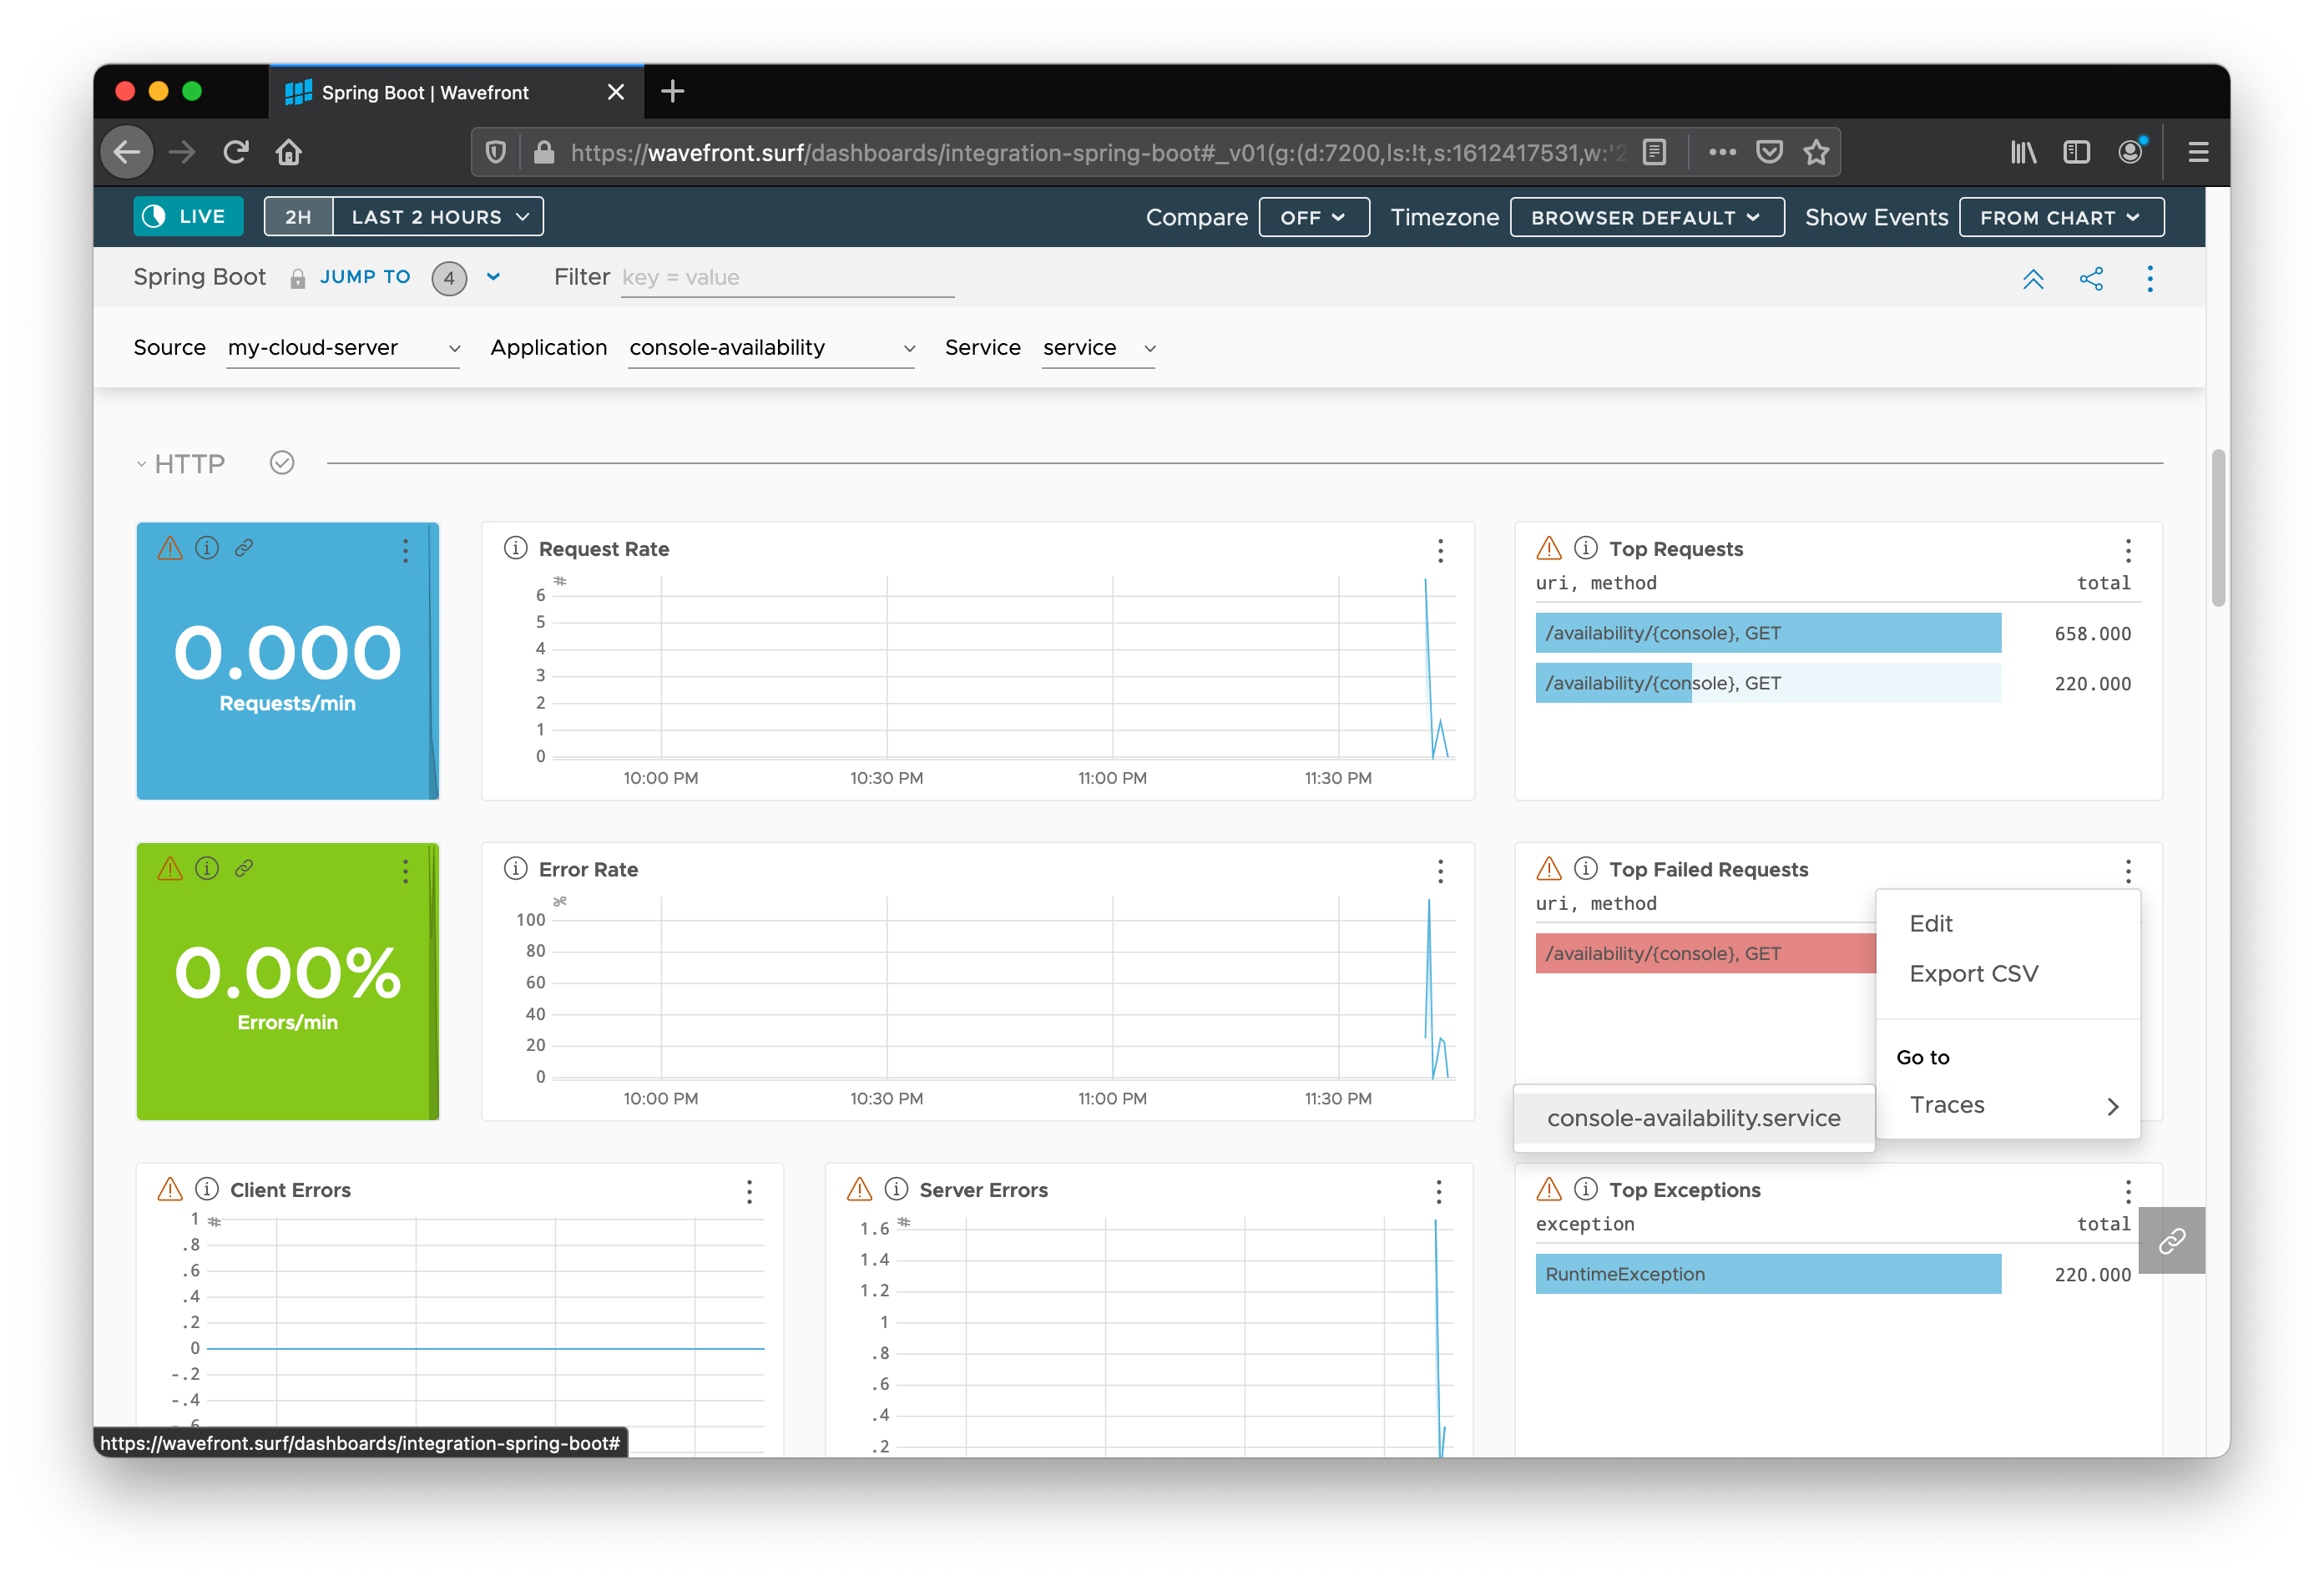
However, there is always the trace data. Click on the little breadcrumb/sandwich icon to the right of “Top Failed Requests”. Then find the service by going to Traces > console-availability.
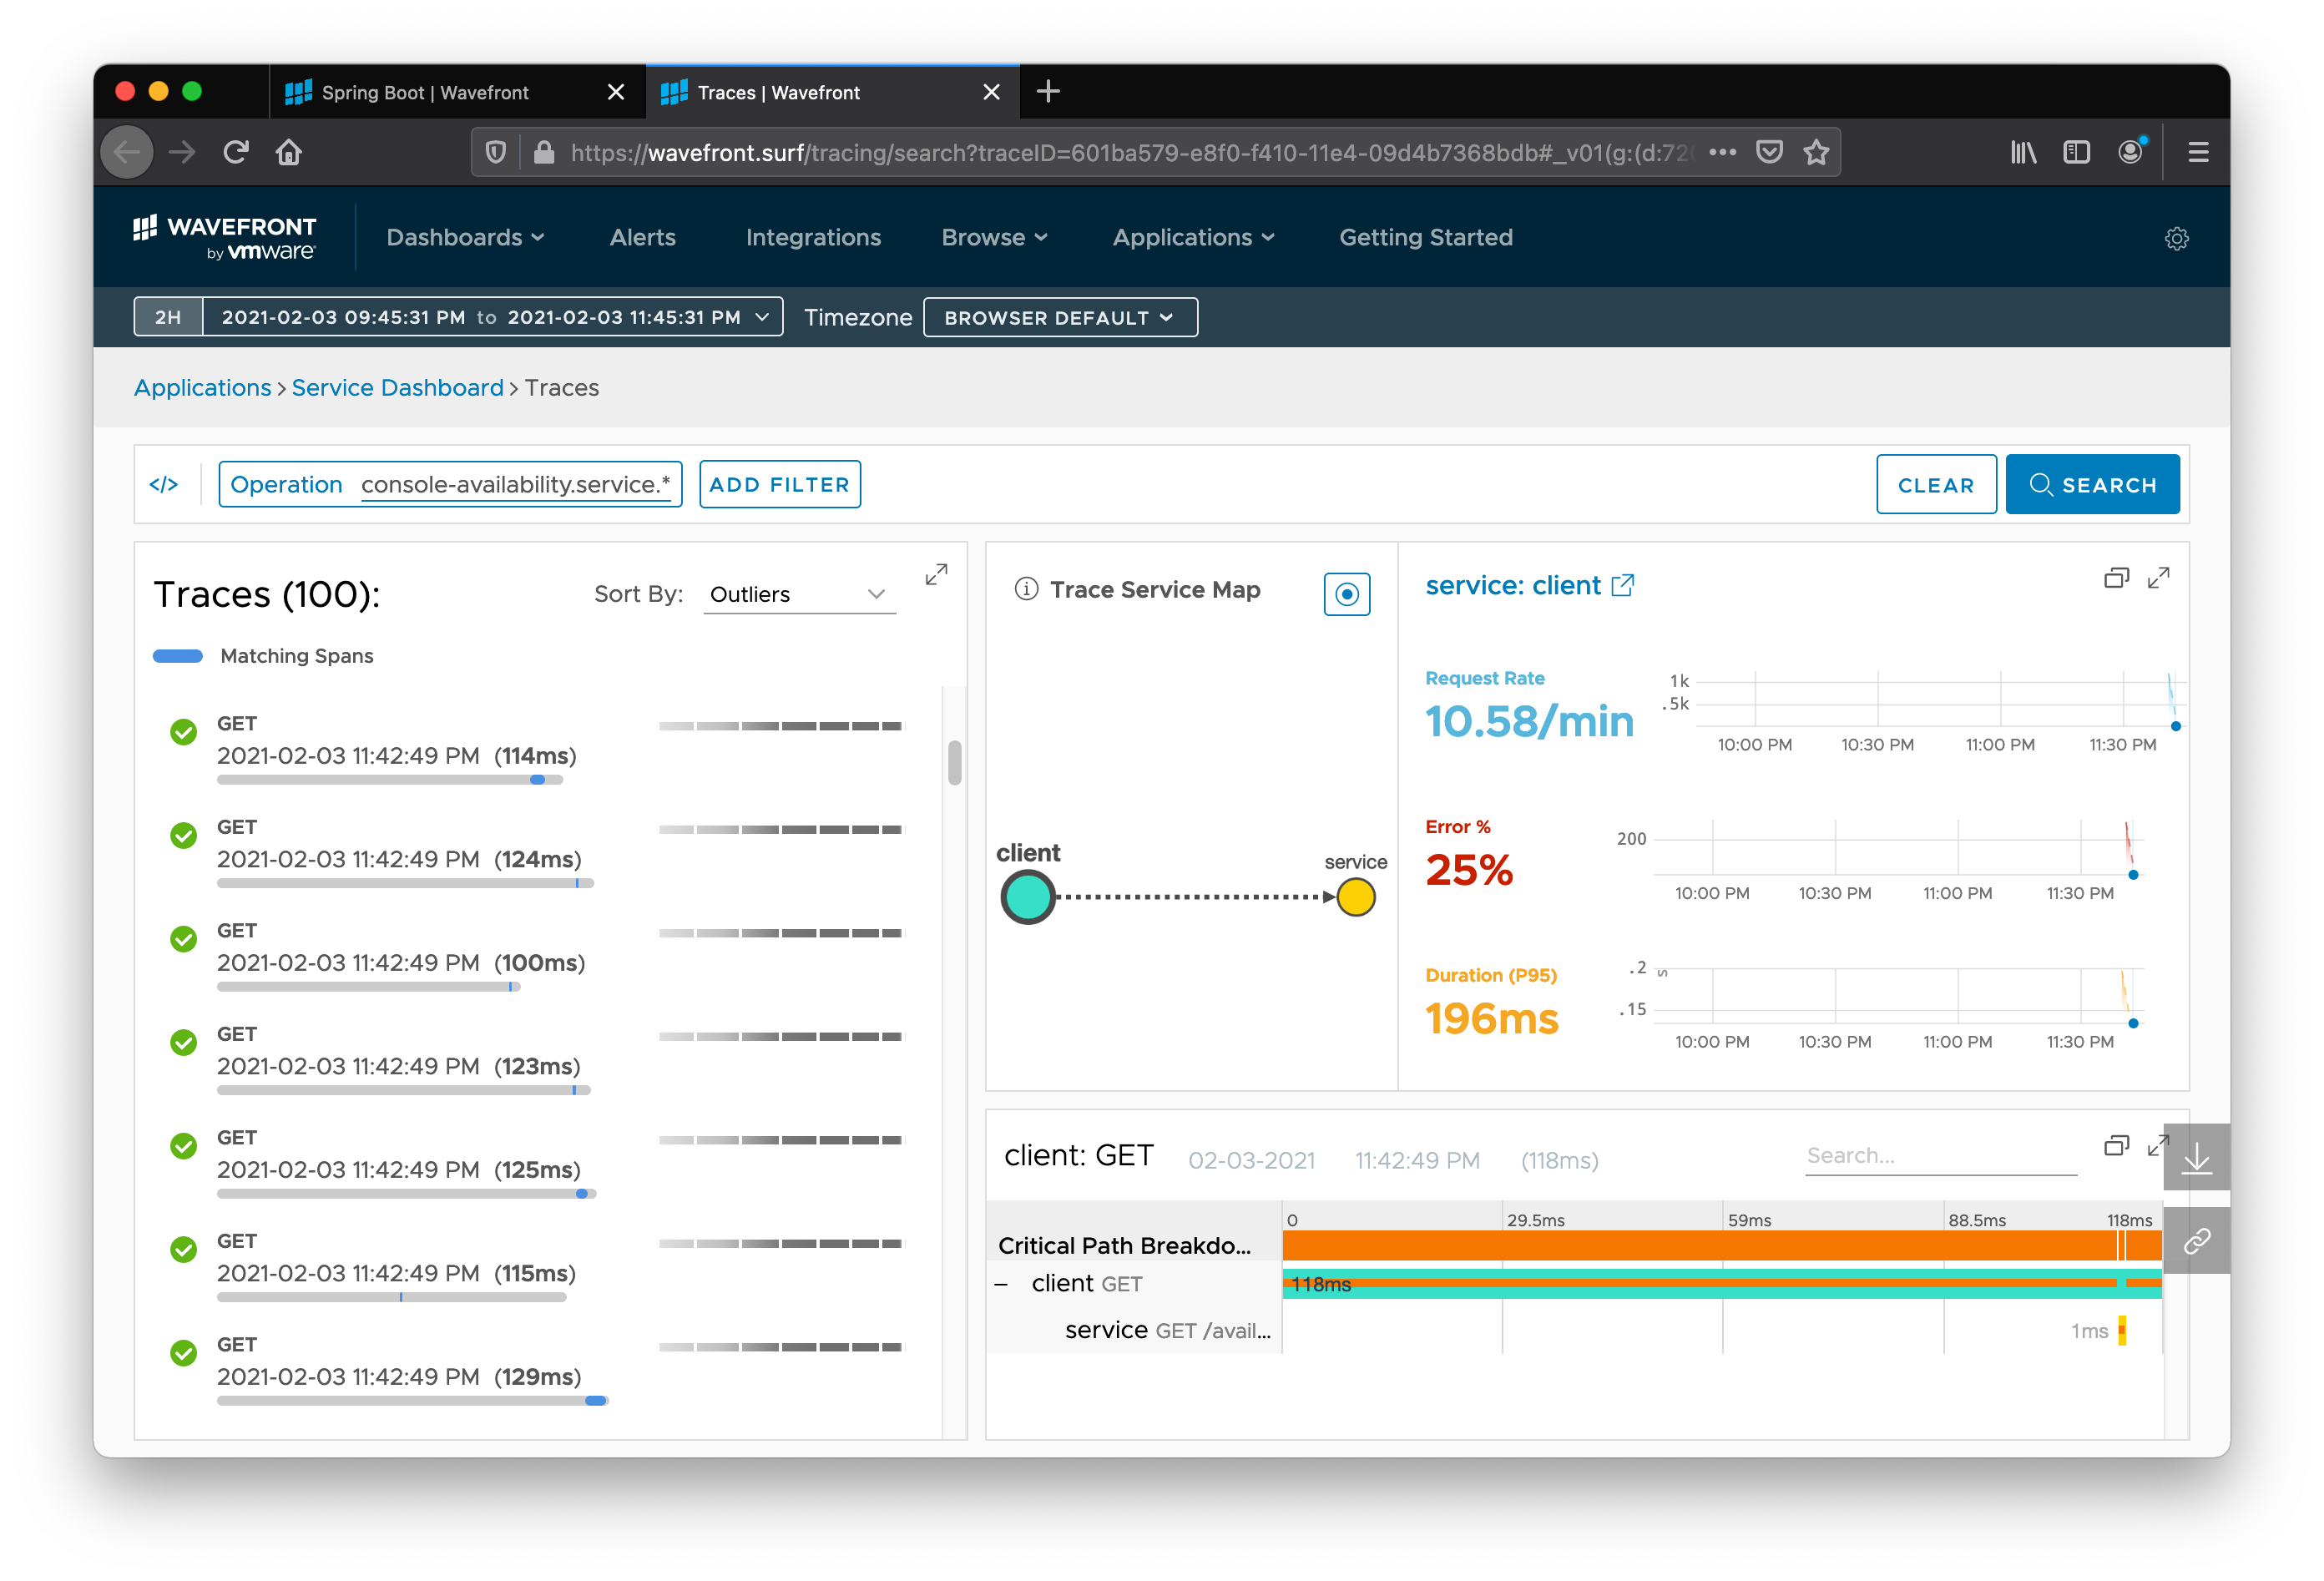
The following screenshot shows all the traces collected for the application (good, bad, or otherwise):
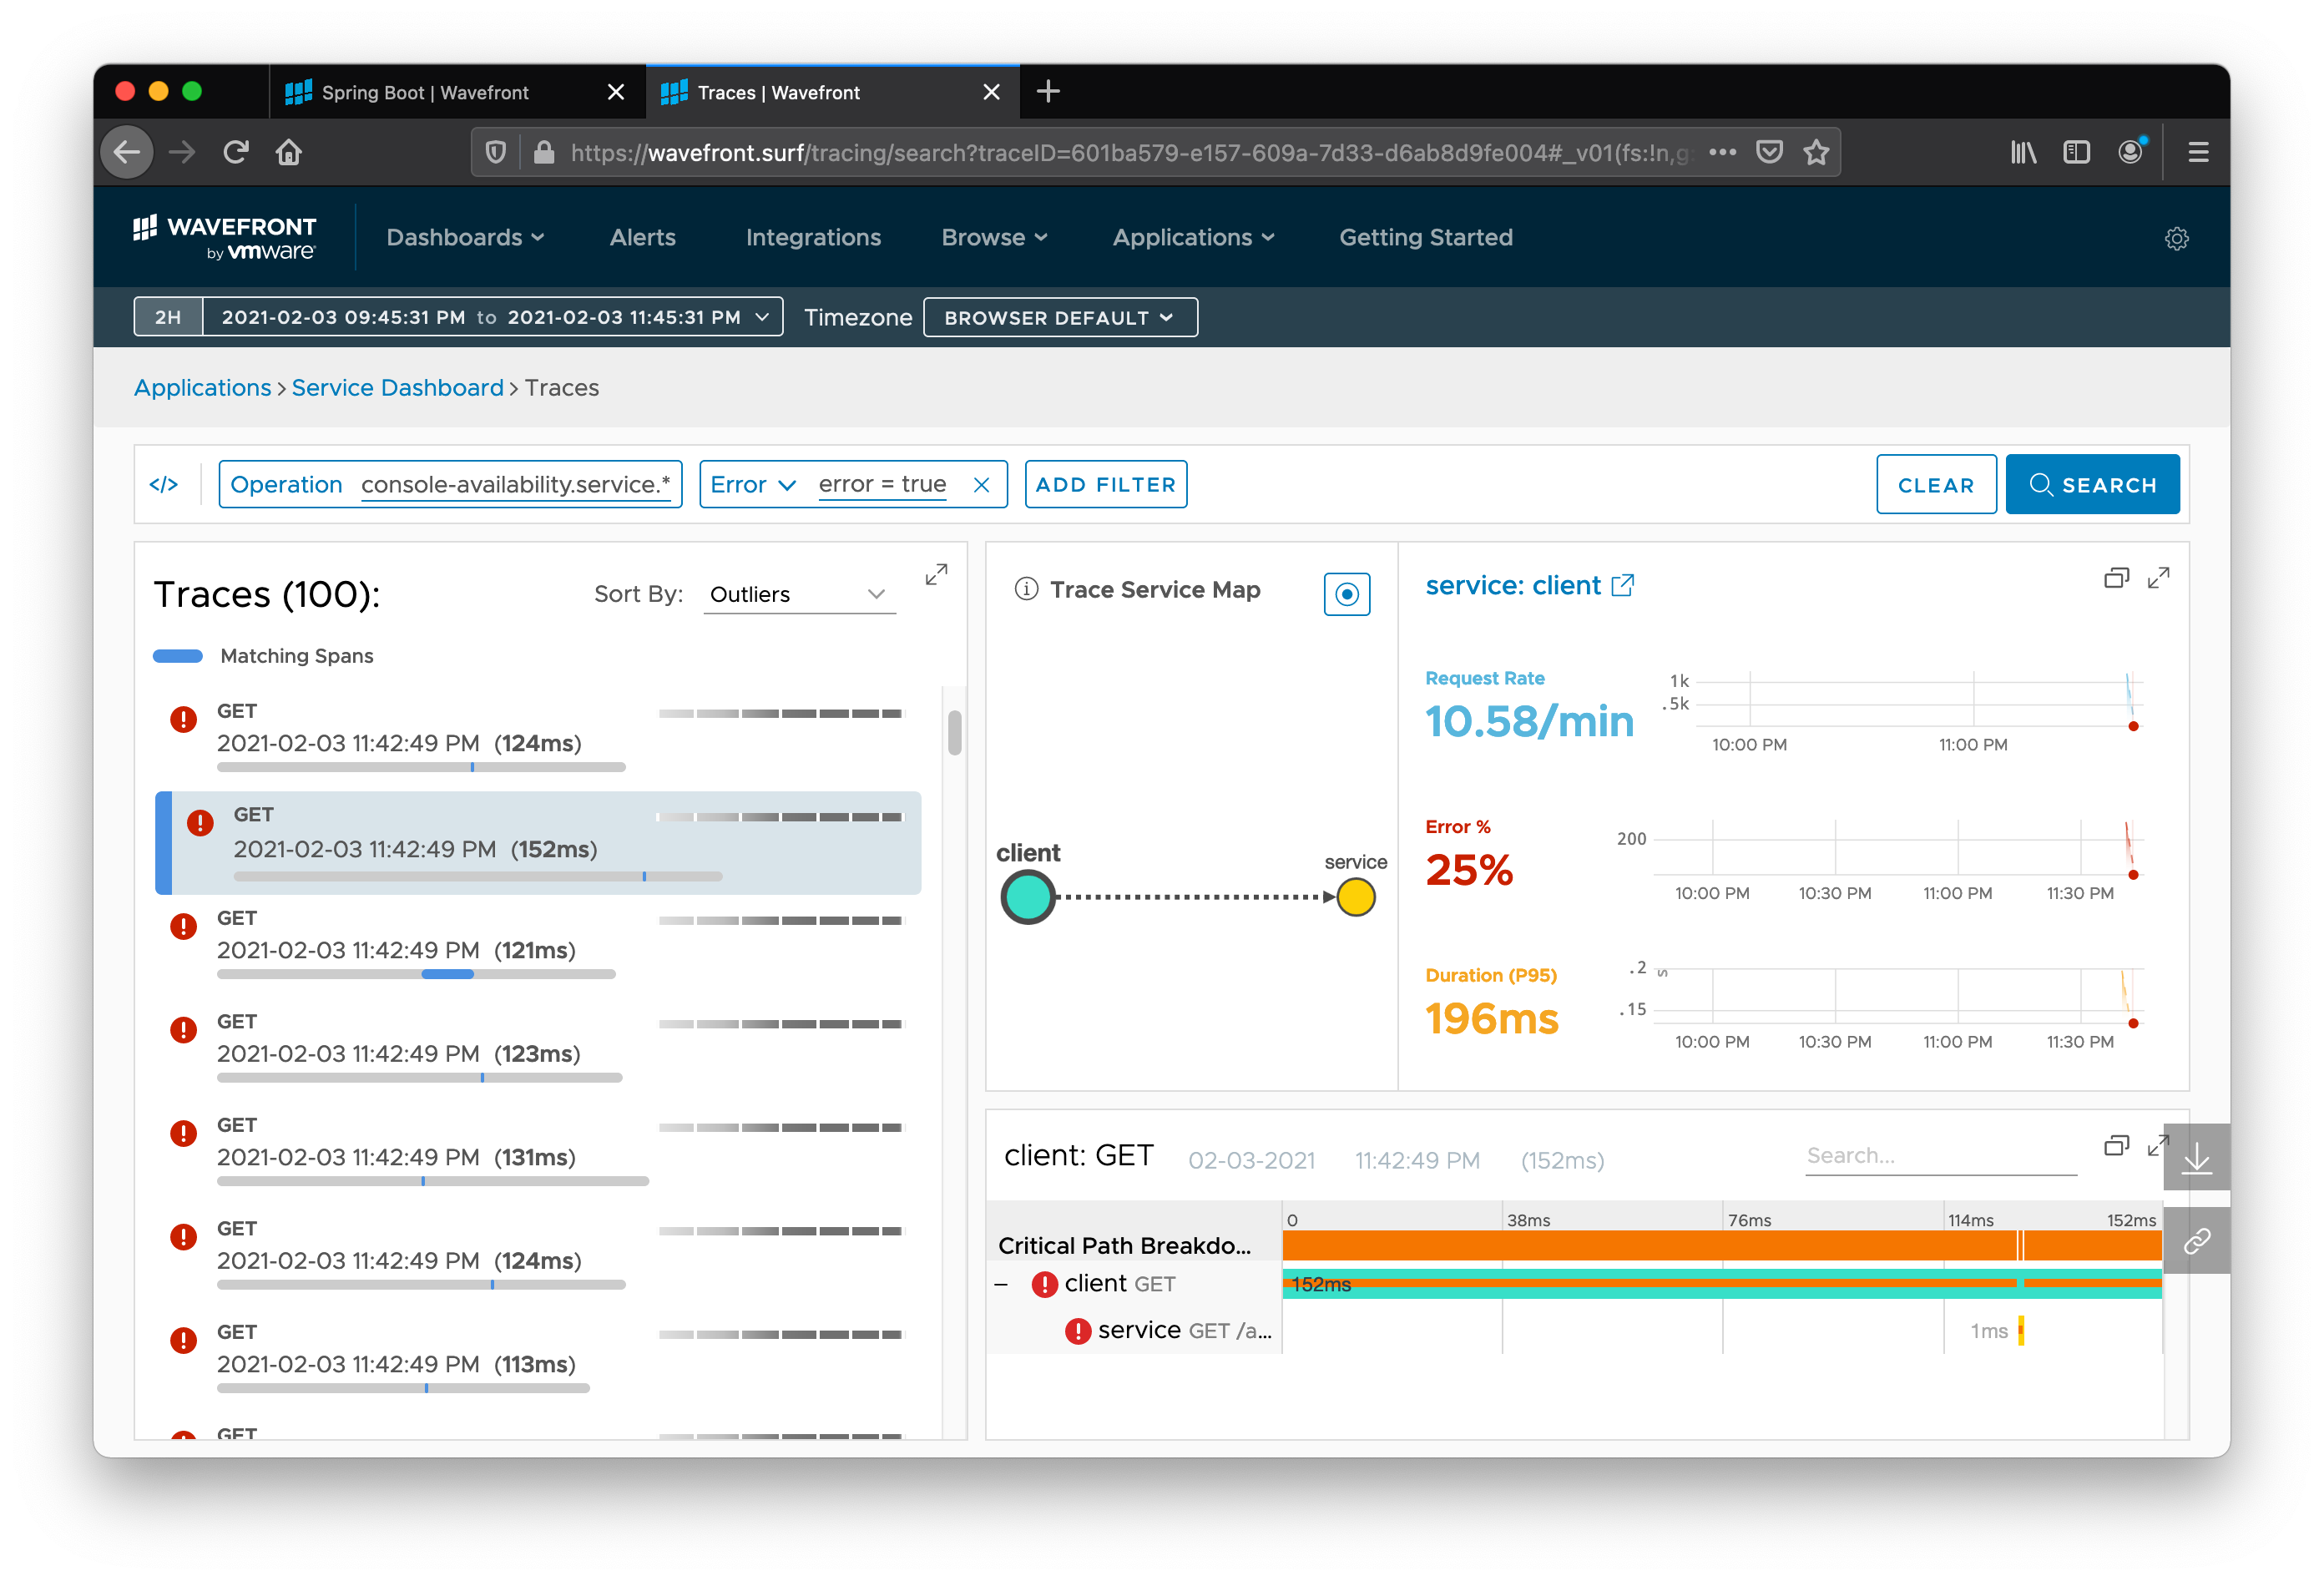
Now we can drill down into only the errant requests by adding an Error filter to the search. Then we can click Search. Now we can scrutinize individual errant requests. You can see how much time was taken in each service call, the relationship between services, and where the error originated.
Click on the expand icon for the panel labeled “client: GET” in the bottom right. You can see each hop in the request’s journey, how long it took, the trace ID, the URL, and the path.
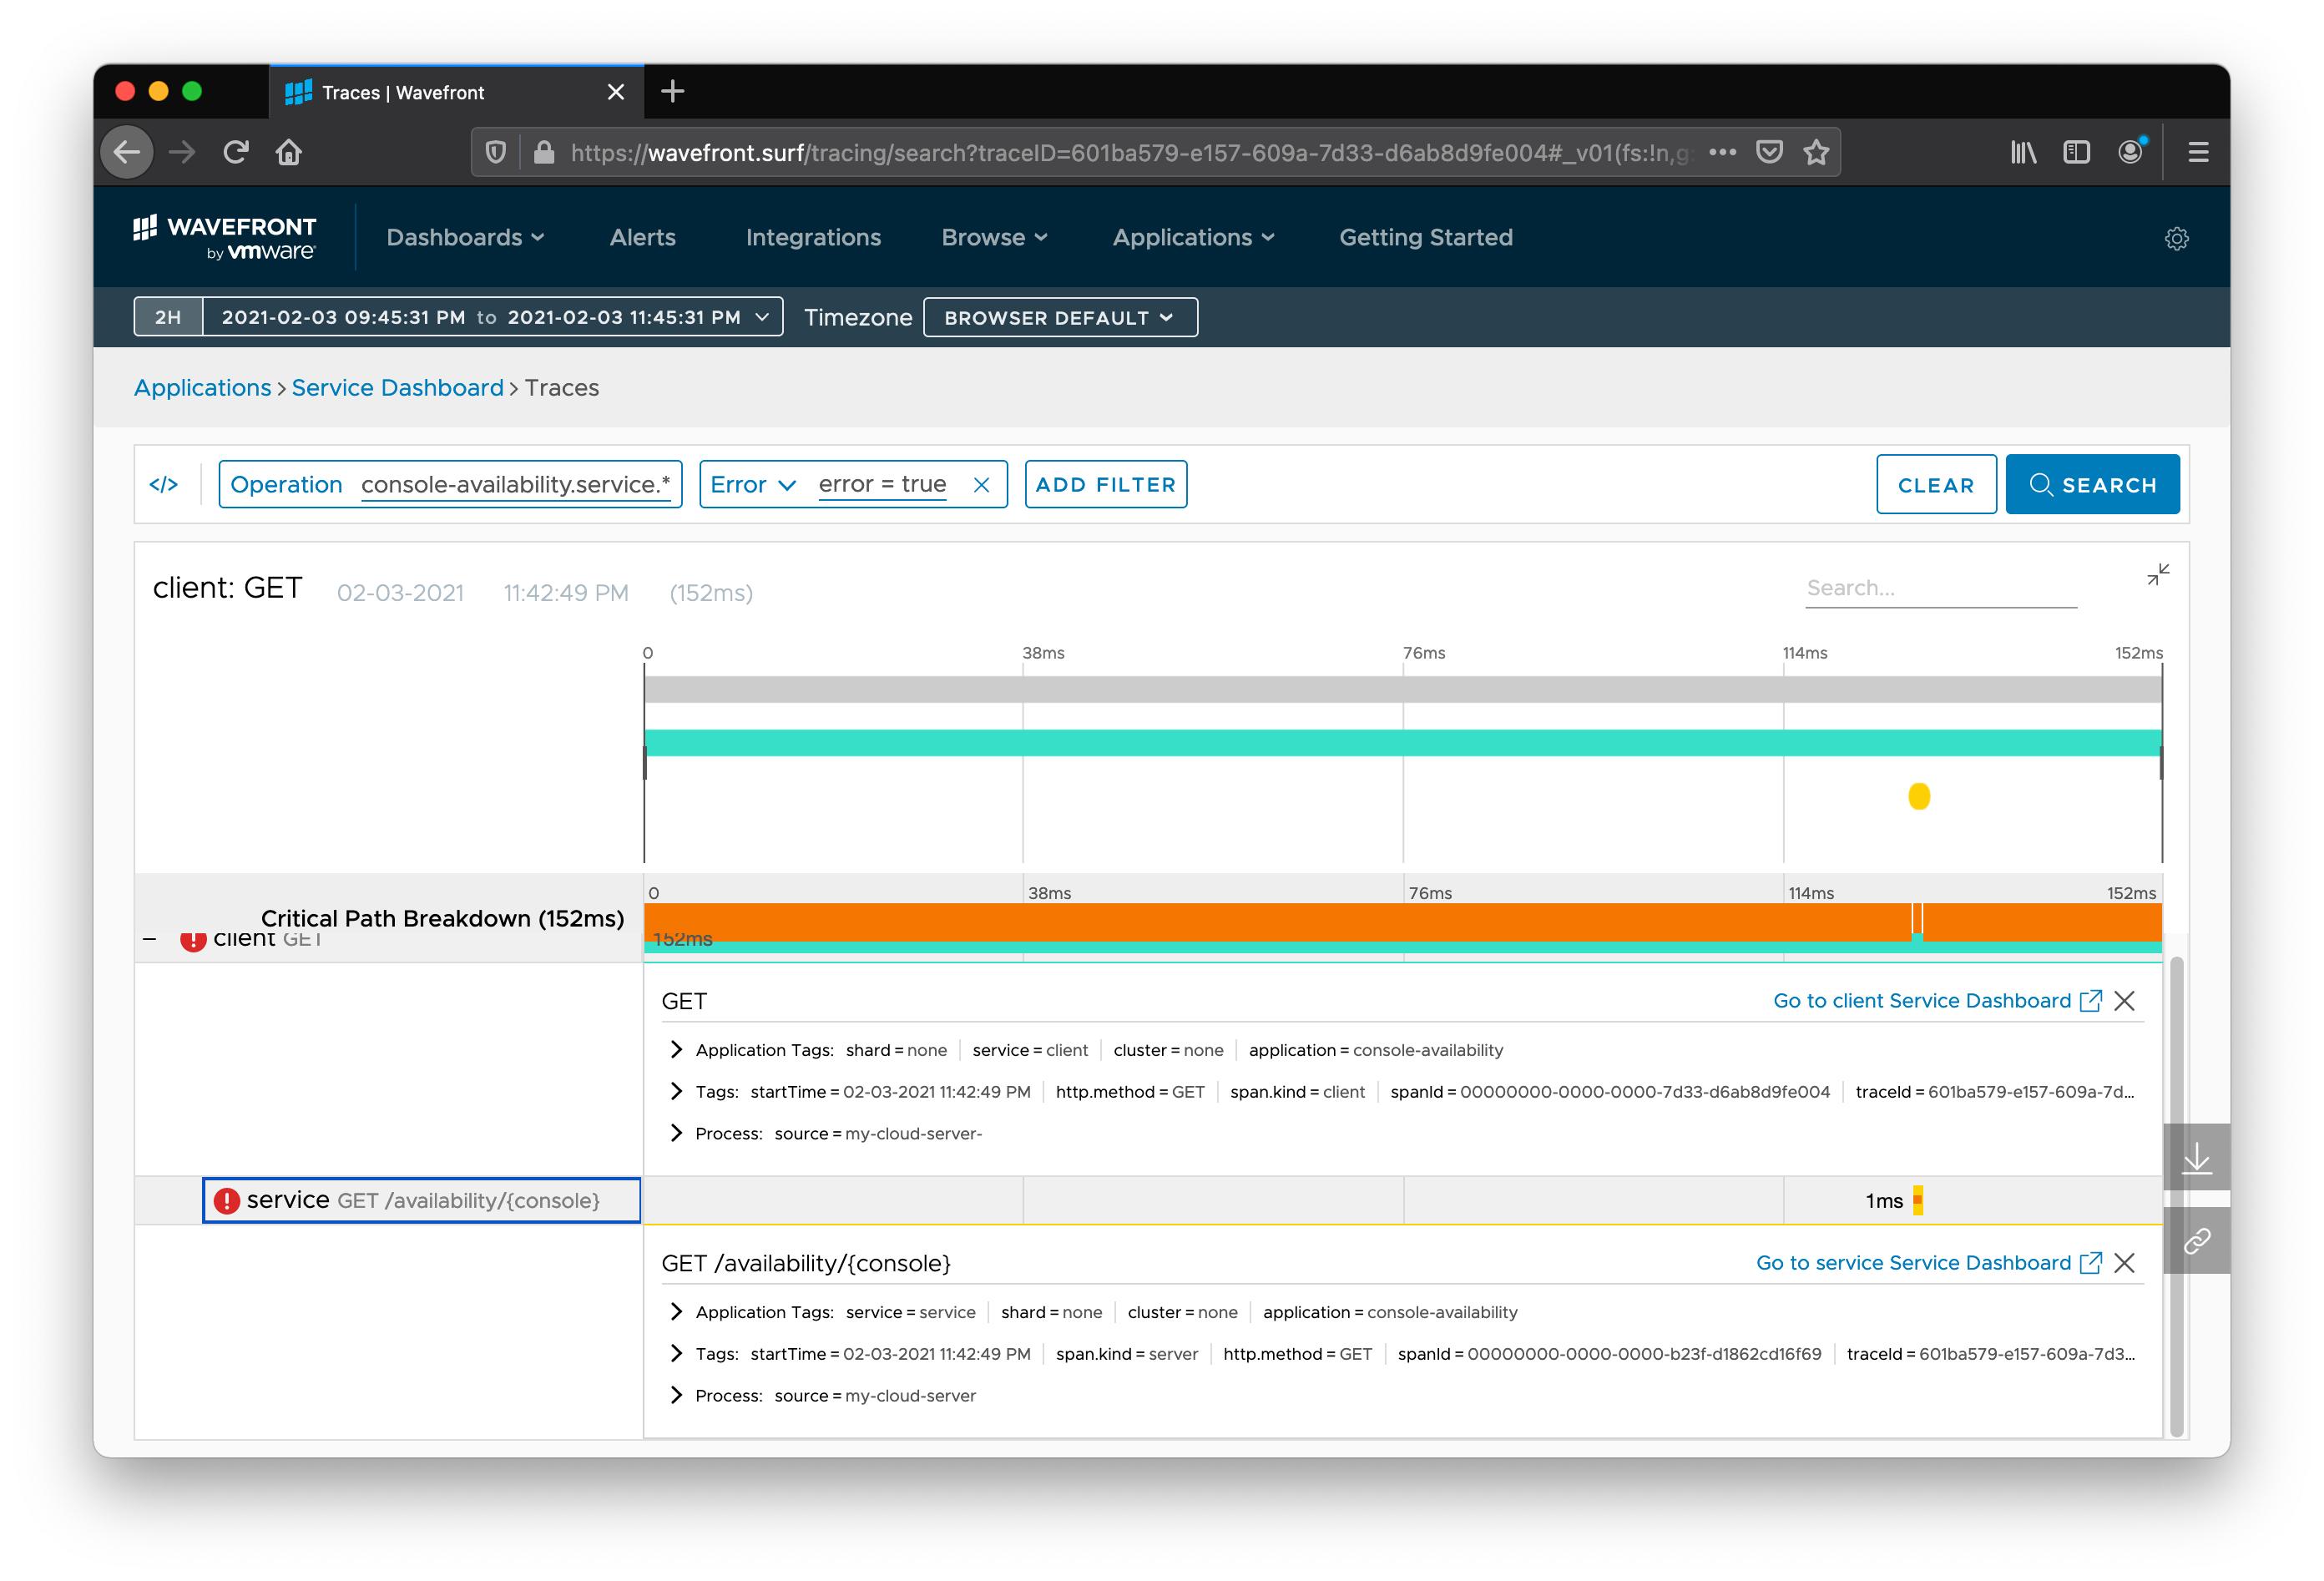
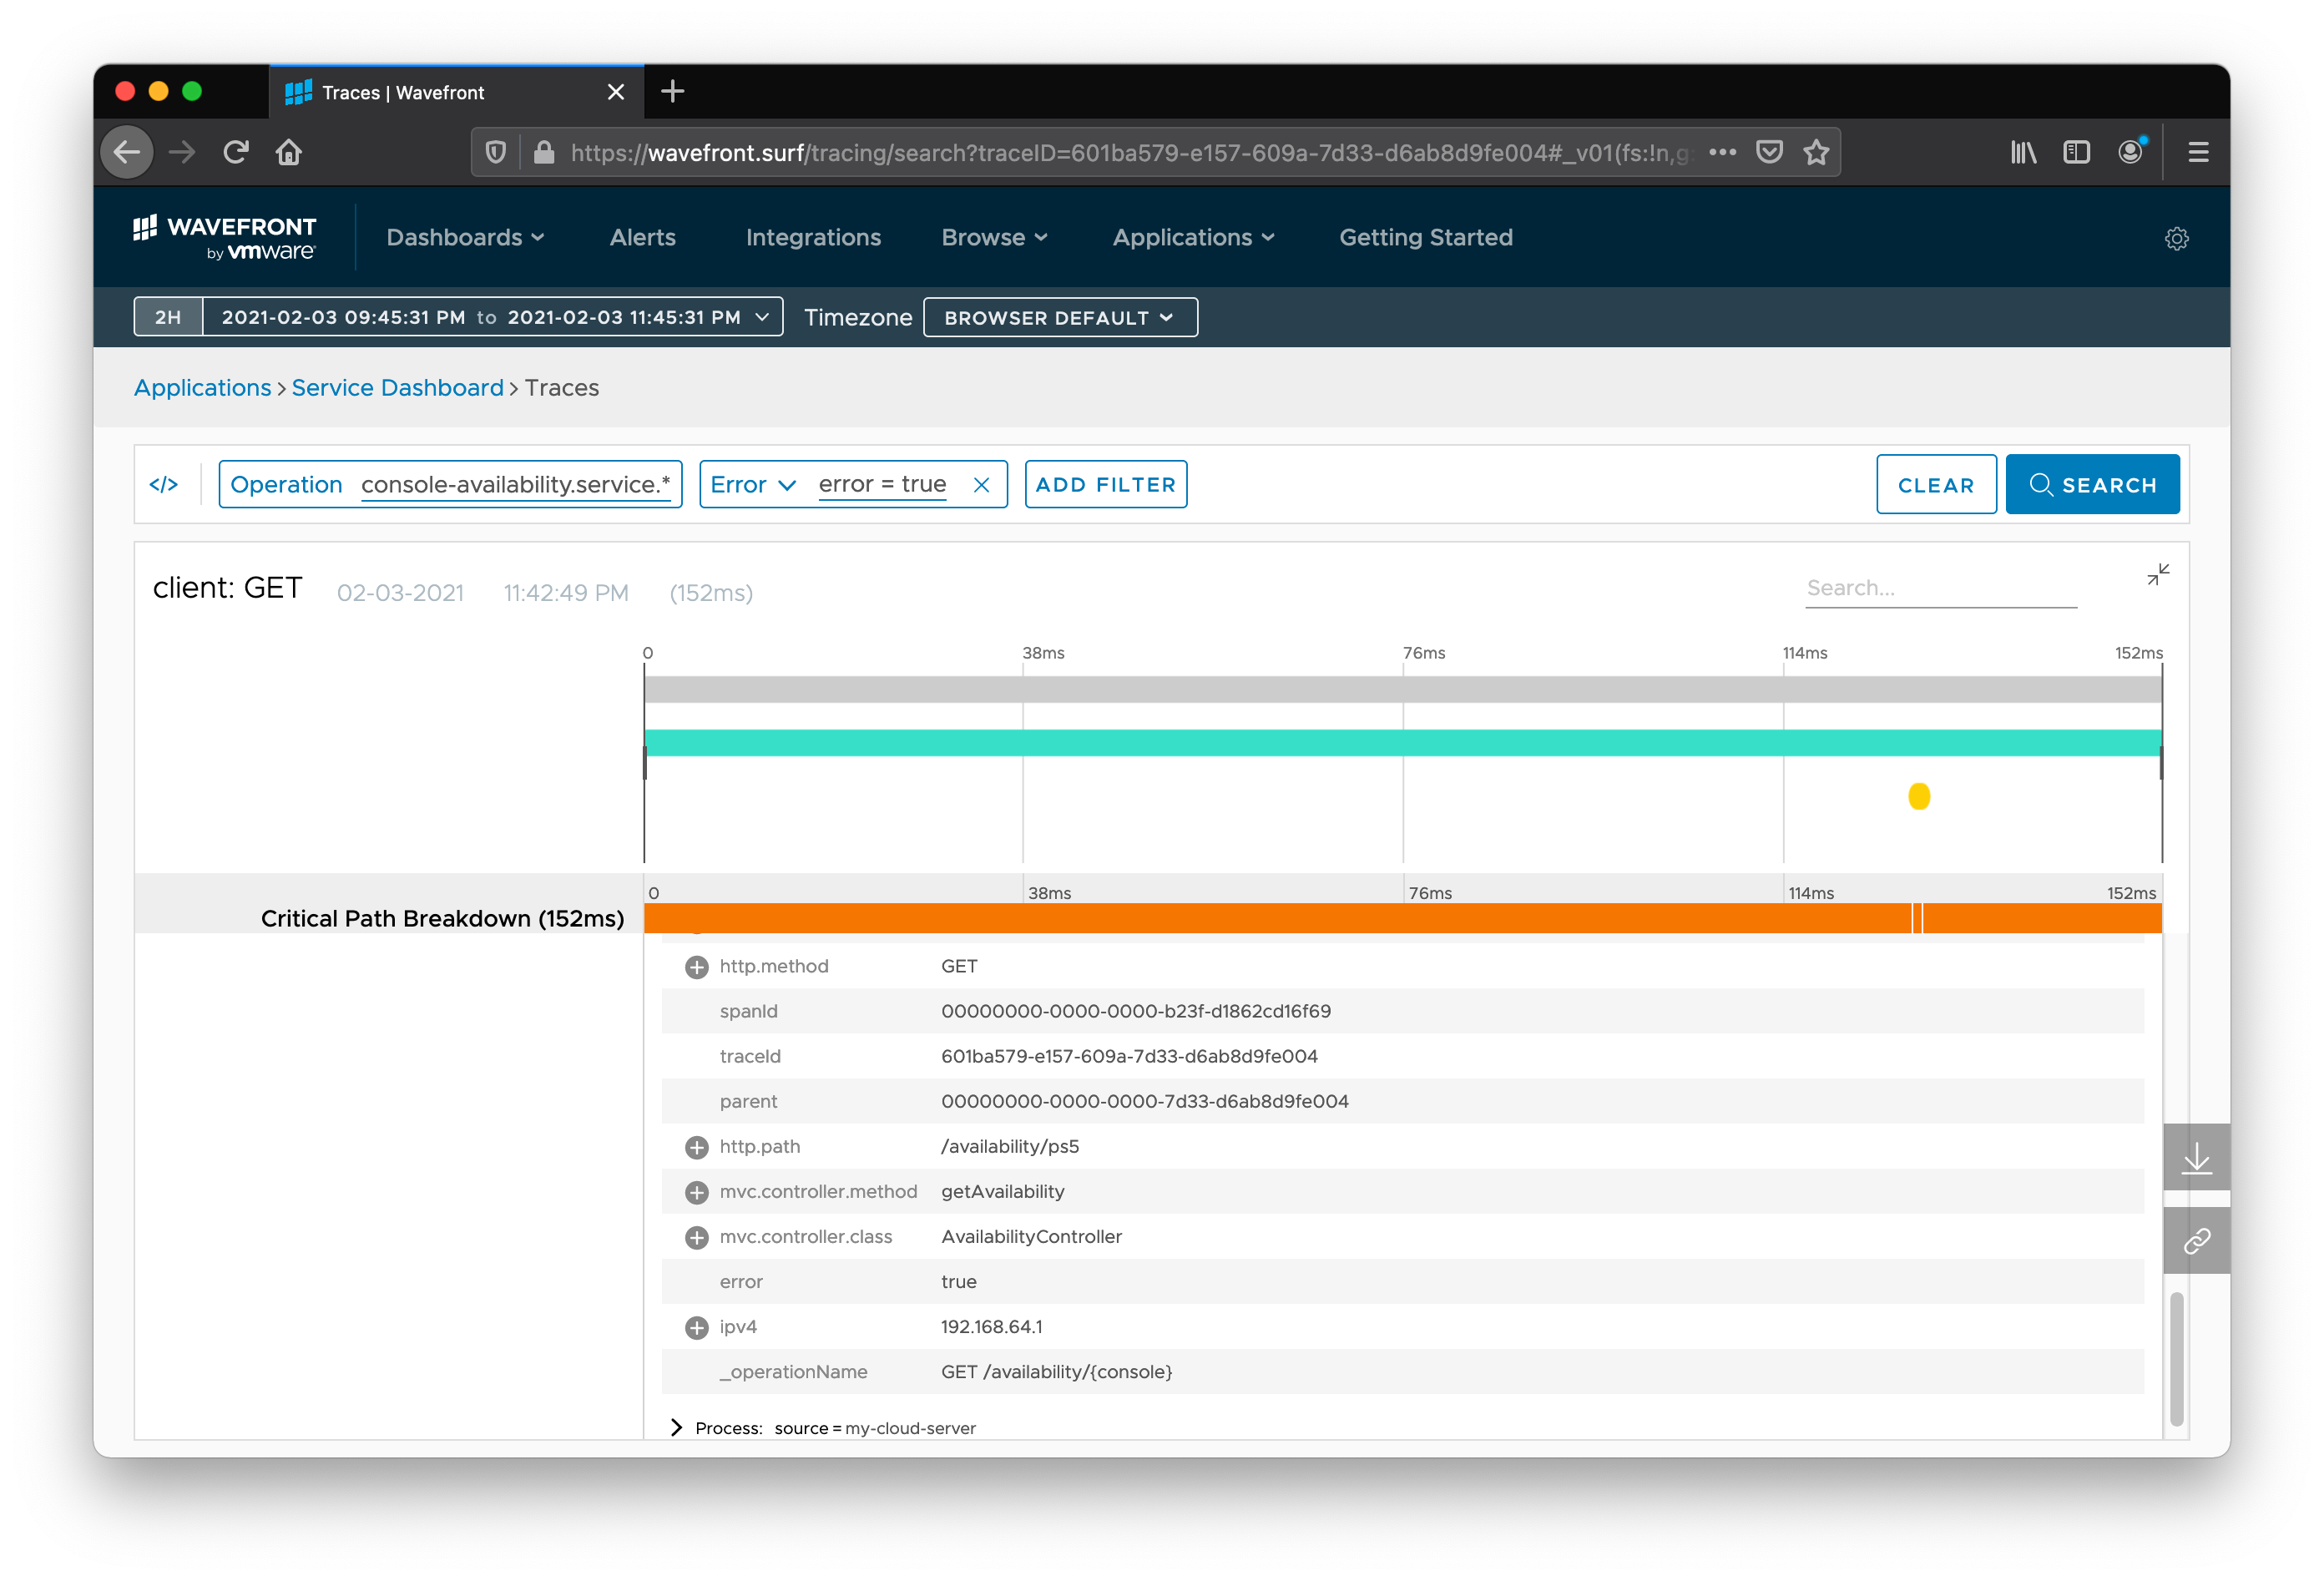
Expand the Tags branch under a particular segment of the trace, and you can see the metadata that Spring Cloud Sleuth automatically collected for you. A trace is made up of individual segments, called spans, that describe one hop in the request’s journey.
Enhancing the Data with Business (Domain) Context
Often, developers are at least as interested in tracking business information as they are in tracking information like the number of hops. To that end, we can enhance our application to capture more data, which then appears in the Wavefront dashboard, where we can make decisions based on this information.
To enhance the application, we customize the data captured by Micrometer and Sleuth to drill down into a particular item of data: the type of console our site’s visitors have requested. We can do so by using the {console} path variable. The code already validates that the console’s value falls within a set of well-known consoles. It is important that we validate the input before using it to ensure that the type of console is low cardinality. You should not use arbitrary input (such as a path variable or query parameter) that could be high cardinality as a metric tag, though you could use high cardinality data as a trace tag. Now, instead of determining the type of console from the HTTP path in the trace data, we can use a tag on the metrics and traces.
To make this change, we update the service to inject a SpanCustomizer, to customize the trace information. We also update the service to configure a WebFluxTagsContributor, to customize the tags that are captured by Spring Boot and given to Micrometer. The following listing shows the modified application:
package server;

import io.micrometer.core.instrument.Tags;
import lombok.AllArgsConstructor;
import lombok.extern.slf4j.Slf4j;
import org.springframework.boot.SpringApplication;
import org.springframework.boot.actuate.metrics.web.reactive.server.WebFluxTagsContributor;
import org.springframework.boot.autoconfigure.SpringBootApplication;
import org.springframework.cloud.sleuth.SpanCustomizer;
import org.springframework.context.annotation.Bean;
import org.springframework.util.Assert;
import org.springframework.util.StringUtils;
import org.springframework.web.bind.annotation.GetMapping;
import org.springframework.web.bind.annotation.PathVariable;
import org.springframework.web.bind.annotation.RestController;
import org.springframework.web.reactive.HandlerMapping;

import java.util.Map;
import java.util.Set;

@Slf4j
@SpringBootApplication
public class ServiceApplication {

    @Bean
    WebFluxTagsContributor consoleTagContributor() {
        return (exchange, ex) -> {
            var console = "UNKNOWN";
            var consolePathVariable = ((Map<String,String>) exchange.getAttribute(HandlerMapping.URI_TEMPLATE_VARIABLES_ATTRIBUTE)).get("console");
            if (AvailabilityController.validateConsole(consolePathVariable)) {
                console = consolePathVariable;
            }
            return Tags.of("console", console);
        };
    }

    public static void main(String[] args) {
        log.info("starting server");
        SpringApplication.run(ServiceApplication.class, args);
    }
}

@RestController
@AllArgsConstructor
class AvailabilityController {

    private final SpanCustomizer spanCustomizer;

    @GetMapping("/availability/{console}")
    Map<String, Object> getAvailability(@PathVariable String console) {
        Assert.state(validateConsole(console), () -> "the console specified, " + console + ", is not valid.");
        this.spanCustomizer.tag("console", console);
        return Map.of("console", console, "available", checkAvailability(console));
    }

    private boolean checkAvailability(String console) {
        return switch (console) {
            case "ps5" -> throw new RuntimeException("Service exception");
            case "xbox" -> true;
            default -> false;
        };
    }

    static boolean validateConsole(String console) {
        return StringUtils.hasText(console) &&
               Set.of("ps5", "ps4", "switch", "xbox").contains(console);
    }

}
Metrics and Tracing Usage
We want to explain why you want both metrics and tracing and how to use each for what. To start, you should consider the framing set up in Peter Bourgon’s Metrics, tracing, and logging blog post.
Tracing and metrics overlap in providing insight on request-scoped interactions in our services. However, some information provided by metrics and tracing is disjointed. Traces excel at showing the relationship between services as well as high-cardinality data about a specific request, such as a user ID associated with a request. Distributed tracing helps you quickly pinpoint the source of an issue in your distributed system. The tradeoff is that, at high volumes and strict performance requirements, traces need to be sampled to control costs. This means that the specific request you are interested in may not be in the sampled tracing data.
On the other side of the coin, metrics aggregate all measurements and export the aggregate at time intervals to define the time series data. All data is included in this aggregation, and cost does not increase with traffic (so long as best practices on tag cardinality are followed). Therefore, a metric that measures maximum latency includes the slowest request, and a calculation of error rate can be accurate (regardless of any sampling on tracing data).
You can use metrics beyond the scope of requests for monitoring memory, CPU usage, garbage collection, and caches (to name a few). You want to use metrics for your alerting, SLOs (service-level objectives), and dashboards. In the console-availability example, it would be an alert about an SLO violation that notifies us about a high error rate for our service. Alerts save you from constantly staring at dashboards and ensure that you do not miss something important.
Then, with both metrics and traces, you can jump from one to the other by using the metadata common to both. Both metrics and trace information support capturing arbitrary key-value pairs with the data called tags. For example, given an alert notification about high latency on an HTTP-based service (based on metrics), you could link to a search of spans (trace data) that match the alert. To quickly get a sampling of traces matching the alert, you can search for spans with the same service, HTTP method, and HTTP URI and that are above a duration threshold.
Conclusion
In short, data is better than no data, and integrated data is better than non-integrated data. Micrometer and Spring Cloud Sleuth provide a solid observability posture but can be configured and adapted to your business’s or domain’s context. Finally, while you could use Micrometer or Spring Cloud Sleuth with any number of other backends, we find Wavefront a convenient and powerful option.
Congratulations! You have a working metrics and tracing application that includes business data.