Get ahead
VMware offers training and certification to turbo-charge your progress.
Learn moreWelcome back Spring community,
to this final part of our series about the new Spring Boot Dashboard in the Spring Tool Suite. In this final part we will take a deeper look at using the Spring Boot Devtools in combination with the boot dashboard. Again, this feature is new with Spring Boot 1.3, so you need to be on that version in order to use the following features.
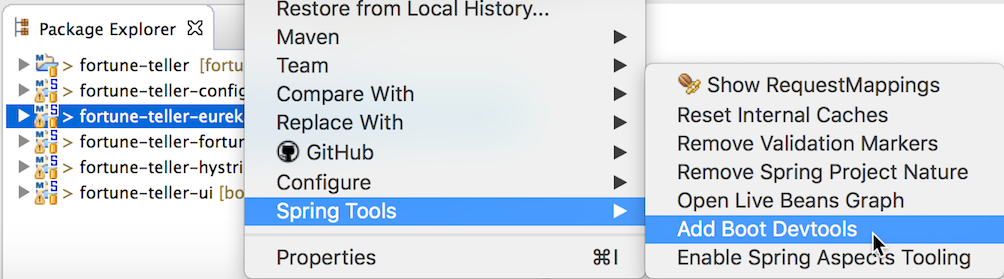
For local apps, using the Spring Boot Devtools is extremely easy and straightforward. As soon as you add the Spring Boot Devtools to your project as a dependency (there is an easy menu option for that in the Spring category of your context menu) and start your app, it will listen for local changes to configuration and class files and kick a restart of the app for you automatically. You don’t even need to restart the app yourself, the Spring Boot Devtools will do that for you automatically. Since STS/Eclipse produces and updates class files whenever you save a file, all this happens automatically for you when working within STS.
This story gets more interesting if you run your Spring Boot apps on a remote runtime like Cloud Foundry. In principle, you can use the Spring Boot Devtools in such a remote setting as well, but it requires a bit more work. The good news is that the Spring Boot Dashboard helps you with that.
As soon as you deploy or restart (and therefore update) a Spring Boot app on Cloud Foundry (using the boot dashboard) that has the Spring Boot Devtools on its classpath, the boot dashboard will configure the boot app on CF for the remote usage of the devtools automatically. This includes primarily the setting of a remote secret - to allow remote devtools access to it.
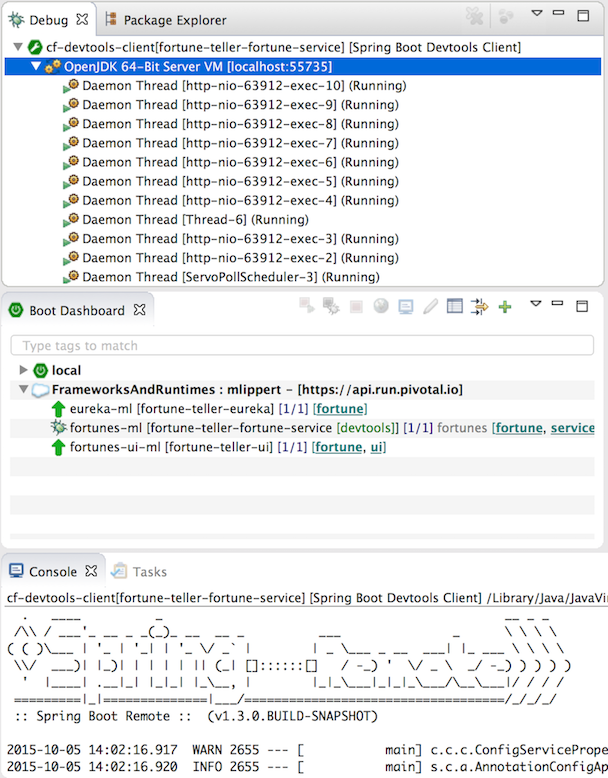
Once the devtools-enabled boot app is running on Cloud Foundry, you can easily start the boot devtools remote client application for it. This client application runs locally on your machine and connects to the remote application on Cloud Foundry. It watches for file changes, uploads them to the app on Cloud Foundry and triggers a restart of the app on Cloud Foundry.

Since the remote client app will watch for file changes within the project on your local machine, you can continue to work within your IDE as usual. Changed files are automatically updated to the Cloud Foundry version of the app by the remote client app. The counterpart on Cloud Foundry will restart the boot app once those changed files are stored to the app on Cloud Foundry. This works for newly compiled source code as well as for changed resource files.
This allows you to achieve quick turnaround cycles when working on your project even if it is deployed to a remote cloud runtime.
In addition to the automatic restart feature, the Spring Boot Devtools also enable full debugging of remote apps on a cloud runtime. This is supported by the Spring Boot Dashboard in STS, too. If you have the Spring Boot Devtools on the classpath of your application, you can press the (re)debug button for the Cloud Foundry instance of the app. This will restart the app on Cloud Foundry in debug mode, automatically start the corresponding remote client app on your machine, and hook up the Eclipse debugger to it.
You can debug the application that is running on the cloud runtime in the same way as local applications, including setting breakpoints, inspecting variables, or even hot-swapping code. However, the automatic restart feature is not available for apps running in debug mode (due to technical limitations of the boot devtools at the moment).
If you try the remote debugging of apps on Cloud Foundry, you will notice a significant slowdown in debugging. This is caused by the tunneling of the remote debug protocol of the JVM through a HTTP connection, something the remote debug protocol is not designed for. We are working on improving this by using a different transport mechanism. But the remote debugging of the app on Cloud Foundry should be something you rarely do. For more frequent debugging you might want to consider running and debugging the app locally and connecting it up with the rest of your application services via the ngrok tunneling feature that we described in the previous part of this blog series.
This concludes the blog series on the Spring Boot Dashboard, a new feature in the Spring Tool Suite since its 3.7.1 release. Let us know about your experiences using the dashboard.

VMware offers training and certification to turbo-charge your progress.
Learn moreTanzu Spring offers support and binaries for OpenJDK™, Spring, and Apache Tomcat® in one simple subscription.
Learn moreCheck out all the upcoming events in the Spring community.
View all