Get ahead
VMware offers training and certification to turbo-charge your progress.
Learn moreWe all love building applications with the latest and greatest technology however at the end of the day we are paid to deliver applications that achieve business goals. We spend each development iteration focusing on how best to achieve these goals but how do we know if the latest iteration achieved its goals? Did the latest release effect the existing business goals being delivered by the application?
SpringSource delivers this capability by giving you visibility into the application with Spring instrumentation, monitoring tools that show trends and reporting tools that allow you to export this data to the management team.
All of the org.springframework.<module>.instrumented jars distributed with this product are simply compile-time woven versions of their counterparts in open source Spring Framework. For example, the org.springframework.beans.instrumented jar file is a drop-in replacement for the org.springframework.beans jar distributed with open source Spring Framework.
Instrumented Spring Framework automatically discovers applications by advising the refresh method of the AbstractApplicationContext. Any bean that is created through an AbstractApplicationContext will be discovered as a managed resource if the instrumented components know how to manage and monitor it. There are some components created outside of ApplicationContexts that will also be auto-discovered. When an AbstractApplicationContext is closed, its associated managed resources will be undeployed.
Once managed resources are auto-discovered, the Spring Framework Instrumentation automatically creates JMX ModelMBeans representing each application resource it discovers, and registers these ModelMBeans in an auto-detected MBeanServer. These MBeans contain pre-determined attributes representing either metrics or properties of the resource being managed and operations that provide runtime control of the resource being managed.
Instrumented Spring Framework monitors most of its managed resources using a combination of compile-time woven aspects and hooks into existing Spring Framework code. Instrumented Spring Framework also uses Spring AOP proxies to monitor the method executions of stereotyped components in your application (marked with @Controller, @Transactional, @Service, @Repository or @Component).
We don't limit the Instrumented Spring Framework to just Core Spring Framework but also provide this capabilities on Spring Web Flow, Spring Security and Spring Web Services. Spring 3.0 also introduces additional annotations to allow advanced metric capture. We will hopefully cover this in more detail in future blogs.
HQ auto-discovery is powered by Hyperic's System Information Gatherer (SIGAR), a cross-platform API for collecting software inventory data. HQ Agents use SIGAR to discover a broad set of system information, including CPU speed, RAM size, operating system version, hostnames, and IP addresses. Auto-discovery works on all major platforms—Unix, Linux, Windows, Mac OSX, Solaris, HP-UX, and AIX.
As with all SpringSource products, Hyperic HQ is built on open source. As this blog is focused on advanced reporting that will end up with a nice report a manager can understand, I am going to use Hyperic Enterprise Edition. You can get full details on the difference between Hyperic Enterprise Edition and Hyperic HQ open source at http://www.hyperic.com .
If you are using the Instrumented Spring Framework it will automatically discover the internal metrics with your application. This includes internal metrics regarding Spring Core, Spring DAO, Spring ORM, Spring JEE Integration, Spring MVC and application metrics you have annotated with the Instrumented Spring Framework.
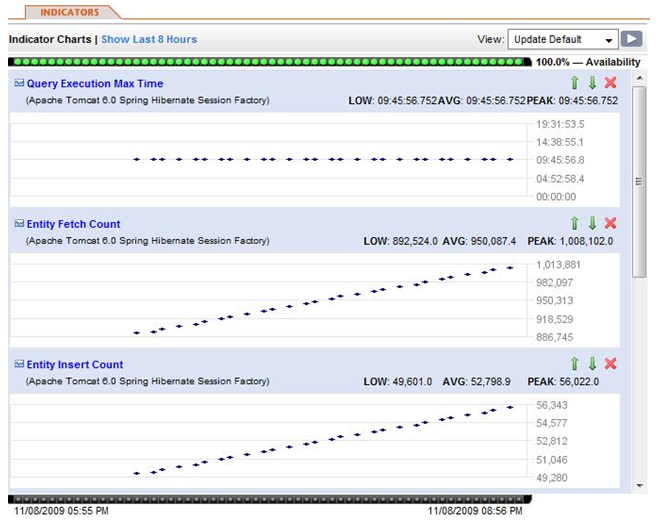
As an example I added the Instrumented Spring Framework to the Spring Travel demo application and deployed it in Tomcat and used Apache jMeter to throw some load at the system. Here is a screen shot of the Hibernate metrics from Spring ORM that were automatically detected by HQ.

The point of the blog however is the get out business metric. Instrumented Spring Framework exposes of all public methods of anything annotated with @Service automatically. This means my "saveBooking" method within my service is automatically exposed :

Wow, now I have the ability to measure the effect the latest development iteration had on the business. Plus from an operational perspective, I can now measure the business value associated with each machine in the environment. Remember all I did was drop in the Instrumented Spring Framework and Hyperic HQ did the rest.
As we can see, we have a lot of valuable data coming out of the environment. How can I expose this to my manager?
Exposing a Manager's View
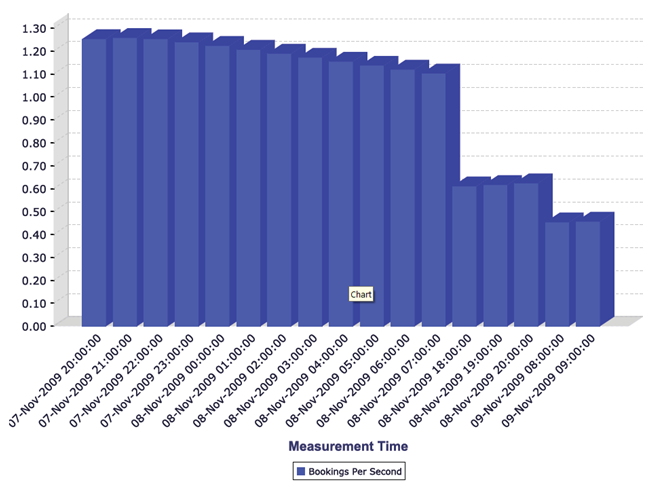
Hyperic IQ, the reporting and intelligence platform, transforms the data collected by Hyperic HQ into systems intelligence that business users can use to analyze, evaluate, plan, and make strategic decisions. This can be applied to any metrics for any resources, in any data center and with a few clicks in Hyperic IQ, I have :

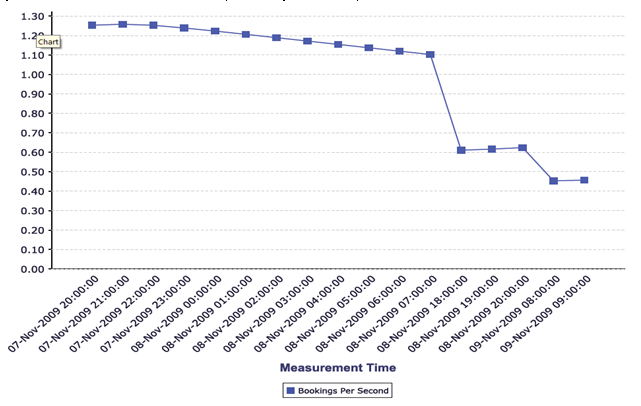
Maybe it works better as a line chart (what do you think??)

As you can see the number of bookings is starting to drop off. This could be due to the natural drop in users during these times, however, as Hyperic HQ is monitoring the complete environment it would be very easy for us to check if this drop off is due to a problem within the application or within the infrastructure itself.
I can now get IQ to mail a PDF of this report to my management team every week and everyone has complete understanding of the real business value the application is delivering.
If you are interested in learning more, feel free to join us on our free weekly Thursday Live HQ Demo at 11am PDT / 2pm EDT. You can also try out Hyperic HQ Enterprise in your own environment by downloading a trial.
It took me longer to write this blog compared with the amount of time needed to get this data out of my application. I dropped in Instrumented Spring Framework and Hyperic did the rest. WOW!