Get ahead
VMware offers training and certification to turbo-charge your progress.
Learn moreWelcome Spring community,
This is the first of three blog entries introducing you to the new Spring Boot Dashboard in STS. You will see how to use the Spring Boot Dashboard in the IDE, learn about the various features it provides, and how it helps you while developing applications based on Spring Boot. Since the Spring Boot Dashboard was introduced in the recently released STS 3.7.1, you will need that version to follow this blog series. If you don't have that installed yet, please go to http://spring.io/tools/ and grab your copy of it.
Spring Boot is now a widely adopted technology to simplify your life when implementing Spring applications for the enterprise. Especially suitable for creating microservice-based applications, it has changed the way we think about small and easy to configure Spring applications dramatically. Together with Spring Cloud, it opens the door to truly cloud-native applications, composed out of probably many microservices.
This dramatic shift in our architectural thinking needs to be reflected in our IDEs as well. Most of our traditional Java IDEs out there were invented not only in the pre-cloud-native era, but in the pre-cloud and to a certain degree in the pre-distributed era of programming. The same is true for the Spring Tool Suite and its base, the Eclipse IDE. It is time to push those IDEs into the cloud-native era. This was the starting point for the Spring Boot Dashboard. Its focus is to help you deal with a potentially larger number of Spring-Boot-based microservice applications and make your life as a developer a lot easier when working on those projects in your IDE.
Starting small and incrementally, the Spring Boot Dashboard comes as an additional view in STS/Eclipse. You can open it by pressing the Spring Boot button in your main toolbar. It opens up a simple view that is in sync with your workspace projects, showing those projects of your workspace that are Spring Boot projects.
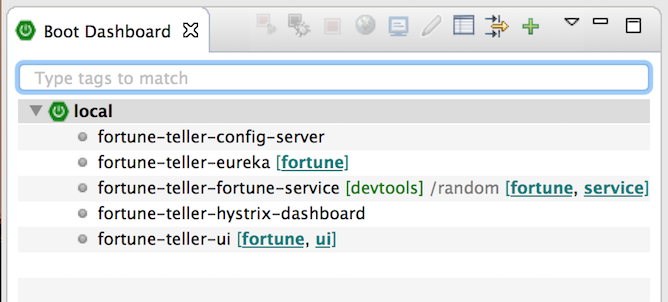
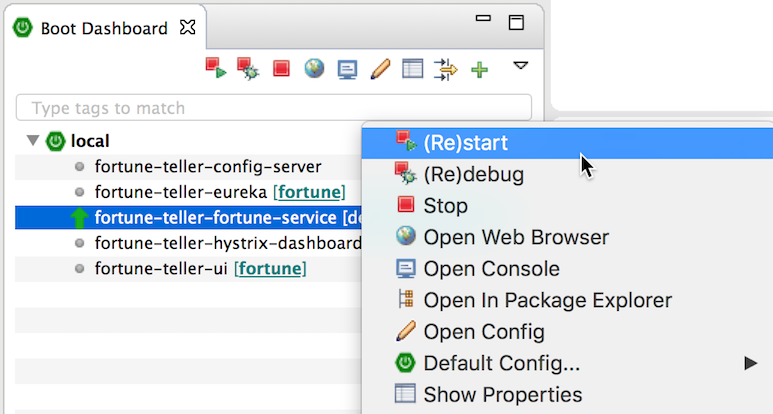
The main purpose of the Boot Dashboard is to give you quick access to the things you do every day, every hour, or even more frequently. You can quickly start your boot apps (in run or debug mode) by selecting them in the boot dashboard and pressing the "run" or "debug" action in the toolbar. There is no faster way to launch your boot app than this. And since you probably are going to change code and want to restart your app, the action lets you restart your boot app, if it is already running. Change your code, press the "run" button in the boot dashboard, and your boot app gets stopped and restarted for you. Again, a simple one-click action.
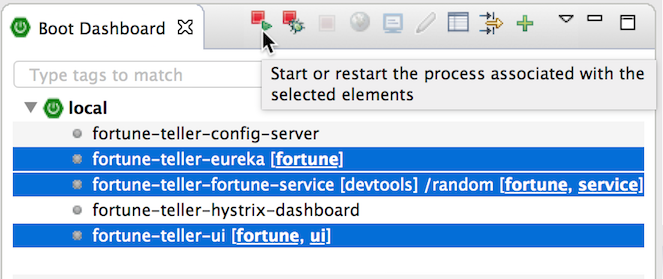
The great thing about these actions (and many more) in the boot dashboard is that they operate on single or multiple projects at the same time. If you want to start or stop a bunch of boot apps at the same time, for example to startup a set of collaborating services, just select them all in the dashboard and press "run". That's it.
As soon as you adopt Spring Boot 1.3 in your projects, you will notice additional goodies showing up in the Boot Dashboard. As soon as your boot app is being started, the boot dashboard visualizes that the app is starting - and it distinguishes between its startup phase (the VM is running, but the app is still initializing) and it is truly running and ready to use. The progress icon indicates the app is still starting up, the green "up" icon shows up as soon as the app is fully initialized and running. You don't need to observe the log output until some "server started" message shows up or something like that. The boot dashboards icons will let you know.
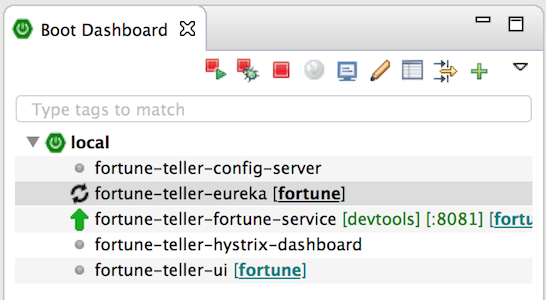
Once the app is running, the port that it listens on will show up in the boot dashboard - for your convenience. You don't have to scan the log output anymore to find out what port is being used by the app. The dashboard displays that information automatically. And in case you would like to jump to the console output of a running boot app, there is a quick action for that as well.
Often there is no need anymore to know about the port of a running app - since you don't have to open a browser tab for the app yourself. Double-click on the project in the boot dashboard and it will open a new browser tab for you - directly navigating to the apps default URL.
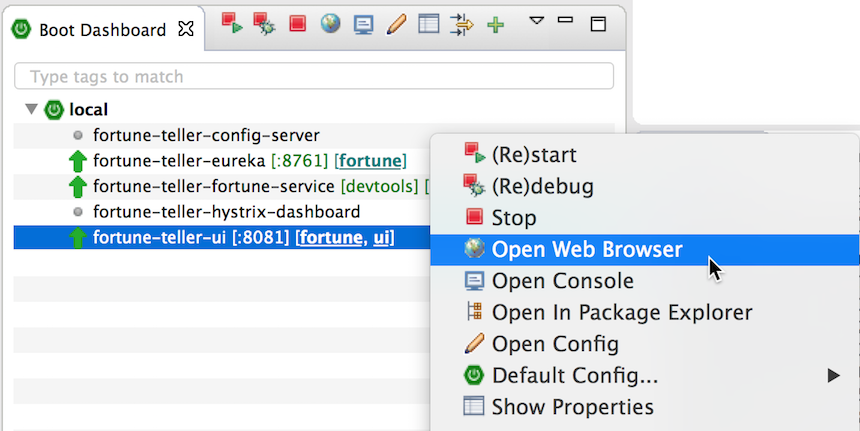
By default, this opens an Eclipse/STS internal browser view. If you prefer to use an external browser, you can set this in the preferences.
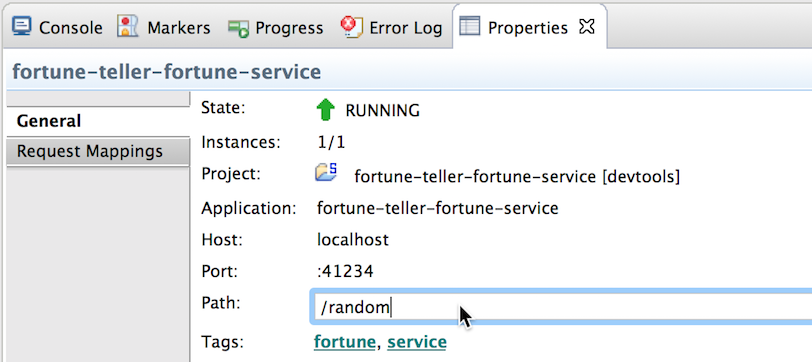
In case this default URL is not the one you would like to visit by default, you can customize that. Open the properties view, select the project in the boot dashboard and enter the default URL extension that you prefer. The double-click will open the default URL of the app + your customized extension to it.
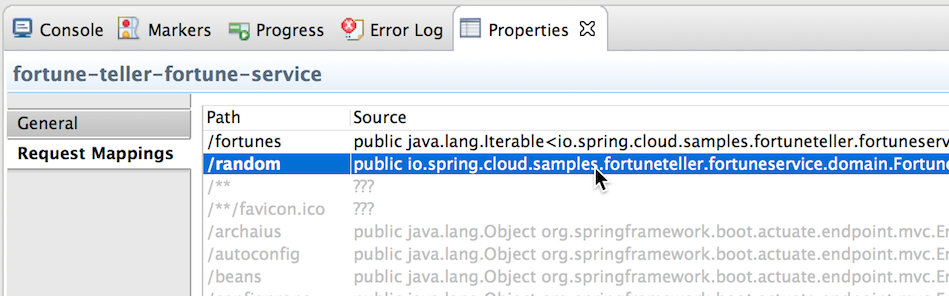
In case you are not sure what URL extensions your application defines, you can select the “Request Mappings” tab in the properties view. All the request mappings of the running app are listed - your self-defined ones at the top, the ones coming from libraries at the bottom of that list. Double-clicking on the URL extension opens a browser for that extension, double-clicking on the code pointer opens the corresponding file of your project in an editor and jumps to the line that defines the request mapping.
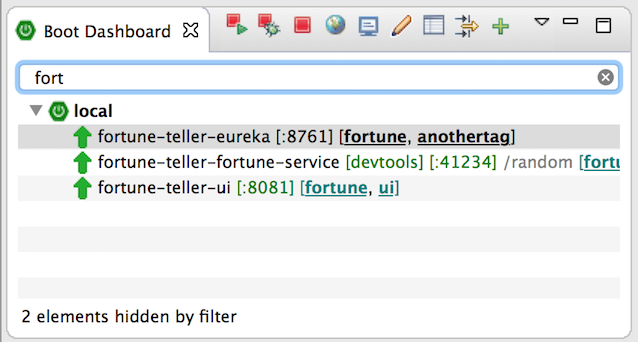
The more microservice projects you have in your workspace, the more likely it is that you don’t work on all of them at the same time. You would like to focus on a subset. In Eclipse/STS, you might have created a working set, for example. The boot dashboard allows you to tag projects with an arbitrary number of tags (again, in the properties view). Those tags can then be used in the filter box (at the top of the boot dashboard) to reduce the number of projects that show up in the boot dashboard.
The second part of this series will introduce you to the Cloud Foundry integration of the Boot dashboard, how to deploy microservices to CF from within the boot dashboard, and how to use local boot apps in combination with those deployed on CF.

VMware offers training and certification to turbo-charge your progress.
Learn moreTanzu Spring offers support and binaries for OpenJDK™, Spring, and Apache Tomcat® in one simple subscription.
Learn moreCheck out all the upcoming events in the Spring community.
View all