Get ahead
VMware offers training and certification to turbo-charge your progress.
Learn moreI was inspired by OpenZipkin contributor and Spring Cloud Sleuth and Zipkin contributor Adrian Cole's epic talk introducing Zipkin to write this particular post. There's so much epic stuff in that talk, so once you're done reading this, go watch that!
Advances in technology and cloud computing have made it easier to stand up and deploy services with ease. Cloud computing enables us to automate away the pain (from days or weeks (gasp!) to minutes!) associated with standing up new services. This increase in velocity in turn enables us to be more agile, to think about smaller batches of independently deployable services. The proliferation of new services complicates reasoning about system-wide and request-specific performance characteristics.
When all of an application's functionality lives in a monolith - what we call applications written as one, large, unbroken deployable like a .war or .ear - it's much easier to reason about where things have gone wrong. Is there a memory leak? It's in the monolith. Is a component not handling requests correctly? It's in the monolith. Messages getting dropped? Also, probably in the monolith. Distribution changes everything.
Systems behave differently under load and at scale. The specification of a system's behavior often diverges from the actual behavior of the system, and the actual behavior may itself vary in different contexts. It is important to contextualize requests as they transit through a system. It's also important to be able to talk about the nature of a specific request and to be able to understand that specific request's behavior relative to the general behavior of similar requests in the past minute, hour, day (or whatever!) other useful interval provides a statistically significant sampling. Context helps us establish whether a request was abnormal and whether it merits attention. You can't trace bugs in a system until you've established a baseline for what normal is. How long is is long? For some systems it might be microseconds, for others it might be seconds or minutes!
In this post, we'll look at how Spring Cloud Sleuth, which supports distributed tracing, can help us establish this context and helps us better understand a system's actual behavior, not just its specified behavior.
Tracing is simple, in theory. As a request flows from one component to another in a system, through ingress and egress points, tracers add logic where possible to perpetuate a unique trace ID that's generated when the first request is made. As a request arrives at a component along its journey, a new span ID is assigned for that component and added to the trace. A trace represents the whole journey of a request, and a span is each individual hop along the way, each request. Spans may contain tags, or metadata, that can be used to later contextualize the request. Spans typically contain common tags like start timestamps and stop timestamp, though it's easy to associate semantically relevant tags like an a business entity ID with a span.
Spring Cloud Sleuth (org.springframework.cloud:spring-cloud-starter-sleuth), once added to the CLASSPATH, automatically instruments common communication channels:
RestTemplate, etc.Spring Cloud Sleuth sets up useful log formatting for you that prints the trace ID and the span ID. Assuming you're running Spring Cloud Sleuth-enabled code in a microservice whose spring.application.name is my-service-id, you will see something like this in the logging for your microservice:
2016-02-11 17:12:45.404 INFO [my-service-id,73b62c0f90d11e06,73b62c0f90d11e06,false] 85184 --- [nio-8080-exec-1] com.example.MySimpleComponentMakingARequest : ...
In that example, my-service-id is the spring.application.name, 73b62c0f90d11e06 is the trace ID and 73b62c0f90d11e06 is the span ID. This information is very useful. You can publish your logs to log analysis and manipulation tools like Elasticsearch and Splunk. There are various ways to get that data there. Logstash, for example, is a log publisher that will write to ElasticSearch. Cloud Foundry automatically aggregates logs from all instances of a service into a unified log through a tool called the Loggregator that can then be forwarded to any Syslog-compatible service, including tools like Splunk or PaperTrail. Whatever approach you take, you can do interesting queries if you have all the logs, and the trace information, in a single place available for query and analysis.
Spring Cloud Sleuth also makes this information available to any Spring Cloud Sleuth-aware Spring application by simply injecting the SpanAccessor. You can also use this to instrument your own components that aren't already instrumented by Spring Cloud so that they can perpetuate trace information. Naturally, each tracer is going to be different, but Spring Cloud Sleuth's code itself (e.g.: TraceFeignClientAutoConfiguration) is suggestive of how a typical tracer works:
...
	@Autowired
	private SpanAccessor spanAccessor;

...
	Span span = this.spanAccessor.getCurrentSpan();
	...
	template.header(Span.TRACE_ID_NAME, Span.toHex(span.getTraceId()));
	setHeader(template, Span.SPAN_NAME_NAME, span.getName() );
	setHeader(template, Span.SPAN_ID_NAME, Span.toHex(span.getSpanId()));
...
Which requests should be traced? Ideally, you'll want enough data to see trends reflective of live, operational traffic. You don't want to overwhelm your logging and analysis infrastructure, though. Some organizations may only keep requests for every thousand requests, or every ten, or every million! By default, the threshold is 10%, or .1, though you may override it by specifying a sampling percentage:
spring.sleuth.sampler.percentage = 0.2
Alternatively, you may register your own Sampler bean definition and programmatically make the decision which requests should be sampled. You can make more intelligent choices about which things to trace, for example, by ignoring successful requests, perhaps checking whether some component is in an error state, or really anything else. The Span given as an argument represents the span for the current in-flight request in the larger trace. You can do interesting and request-type specific types of sampling if you'd like. You might decide to only sample requests that have a 500 HTTP status code, for example. The following Sampler, for example, would trace roughly half of all requests:
@Bean
Sampler customSampler() {
	return new Sampler() {
		@Override
		public boolean isSampled(Span span) {
			return Math.random() > .5 ;
		}
	};
}
Make sure to set realistic expectations for your application and infrastructure. It may well be that the usage patterns for your applications require something more sensitive or less sensitive to detect trends and patterns. This is meant to be operational data; most organizations don't warehouse this data more than a few days or, at the upper bound, a week.
Data collection is a start but the goal is to understand the data, not just collect it. In order to appreciate the big picture, we need to get beyond individual events.
For this we'll use the OpenZipkin project. OpenZipkin is the fully open-source version of Zipkin, a project that originated at Twitter in 2010, and is based on the Google Dapper papers.
Previously, the open-source version of Zipkin evolved at a different pace than the version used internally at Twitter. OpenZipkin represents the synchronization of those efforts: OpenZipkin is Zipkin and when we refer to Zipkin in this post, we're referring to the version reflected in OpenZipkin.
Zipkin provides a REST API that clients talk to directly. Zipkin even supports a Spring Boot-based implementation of this REST API. Using that is as simple as using Zipkin's @EnableZipkinServer directly. The Zipkin Server delegates writes to the persistence tier via a SpanStore. Presently, there is support for using MySQL or an in-memory SpanStore out-of-the-box. As an alternative to REST, we can also publish messages to the Zipkin server over a Spring Cloud Stream binder like RabbitMQ or Apache Kafka. We'll use this option, and org.springframework.cloud:spring-cloud-sleuth-zipkin-stream's @EnableZipkinStreamServer, to adapt incoming Spring Cloud Stream-based Sleuth Spans into Zipkin's Spans and then persist them using the SpanStore. You may use whatever Spring Cloud Stream binding you like, but in this case we'll use Spring Cloud Stream RabbitMQ (org.springframework.cloud:spring-cloud-starter-stream-rabbitmq).
package com.example;

import org.springframework.boot.SpringApplication;
import org.springframework.boot.autoconfigure.SpringBootApplication;
import org.springframework.cloud.sleuth.zipkin.stream.EnableZipkinStreamServer;

@EnableZipkinStreamServer
@SpringBootApplication
public class ZipkinQueryServiceApplication {

	public static void main(String[] args) {
		SpringApplication.run(ZipkinQueryServiceApplication.class, args);
	}
}
Specify a port in application.properties to pin the Zipkin server to a well-known port so that the UI may later talk to it:
server.port=9411
My example code uses the Spring Cloud Netflix-powered Eureka service registry in eureka-servie for service registration and discovery, so start that up next.
Our microservices (message-client and message-service) are typical Spring Cloud microservices. I only added org.springframework.cloud:spring-cloud-sleuth-stream and the appropriate Spring Cloud Stream binder to have their Sleuth traces published, out-of-band, to Zipkin for analysis.
The Zipkin web UI makes it easy to analyze and query Zipkin data. You can run the Zipkin Web build in my example or just grab the latest from the Zipkin project's builds and then run it:
java -jar lib/zipkin-web-all.jar -zipkin.web.port=:9412 -zipkin.web.rootUrl=/ -zipkin.web.query.dest=localhost:9411
When the message-service receives a request it sends a reply message back to the message-client over a Spring Cloud Stream binder which the client then accepts and logs with a Spring Integration messaging endpoint. This is a contrived call sequence to demonstrate some of Spring Cloud Sleuth's power.
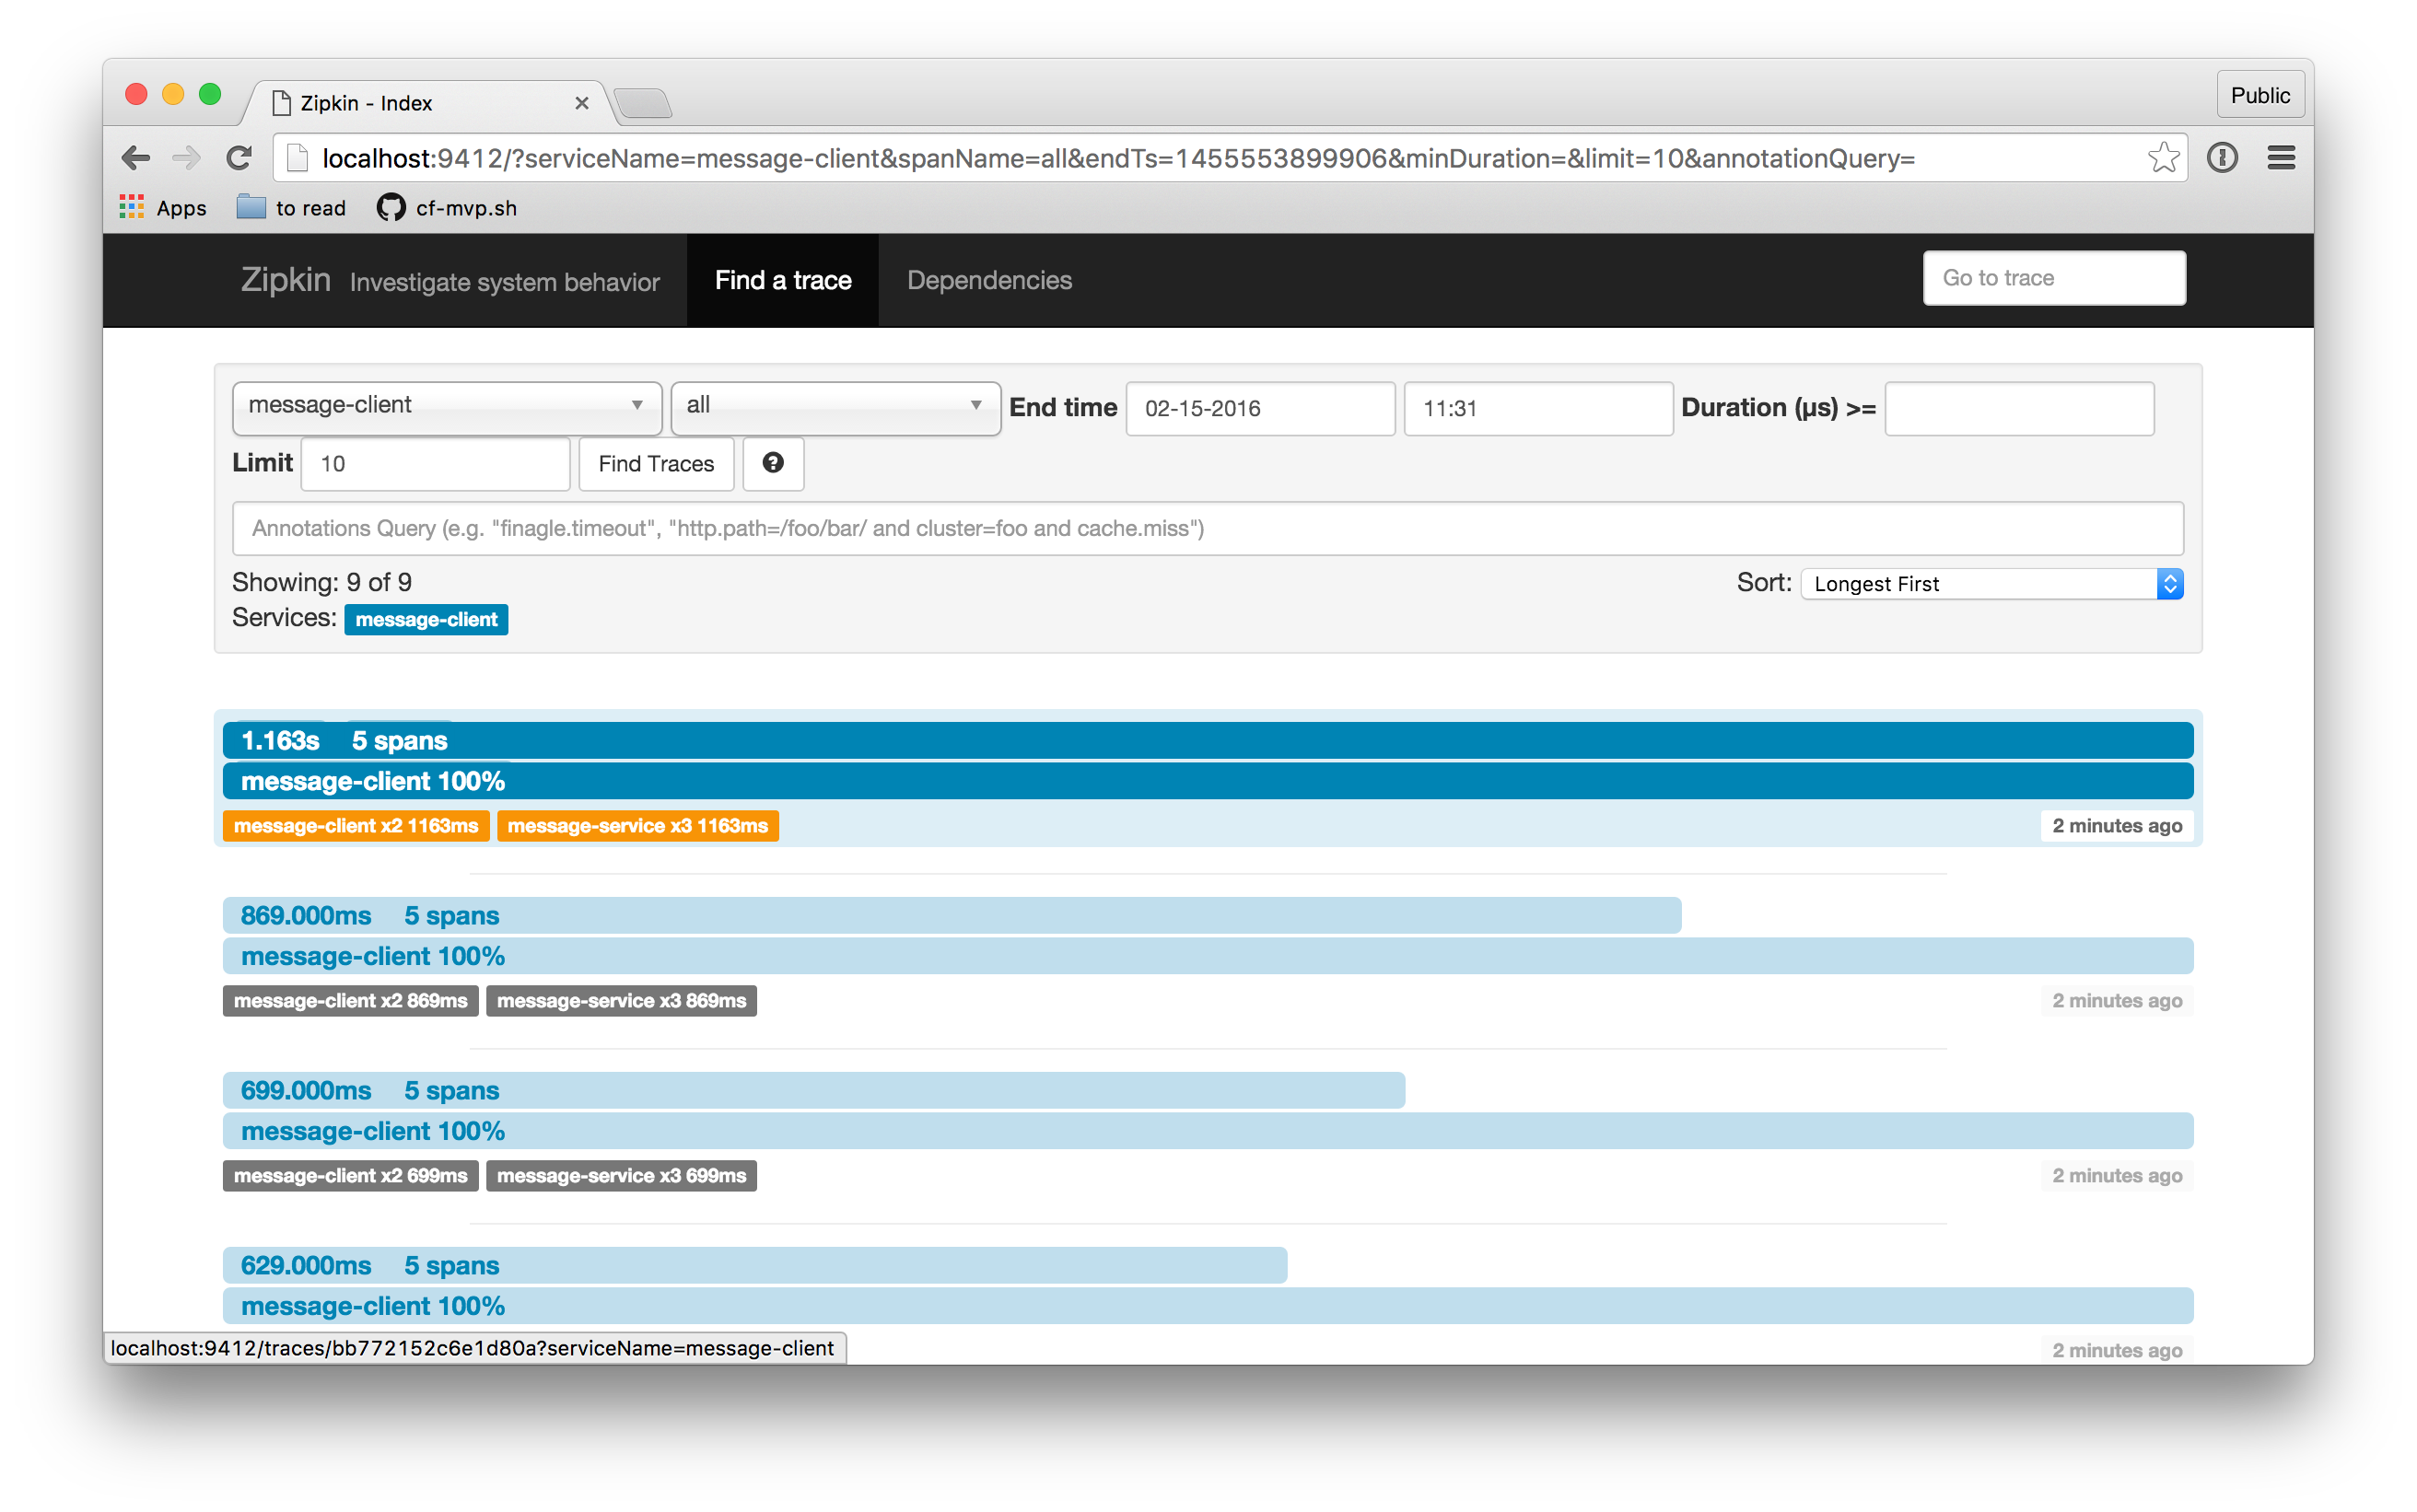
Bring up the UI and then find all the recent traces. You can sort by most recent, longest, etc., for finer-grained control over which results you see.
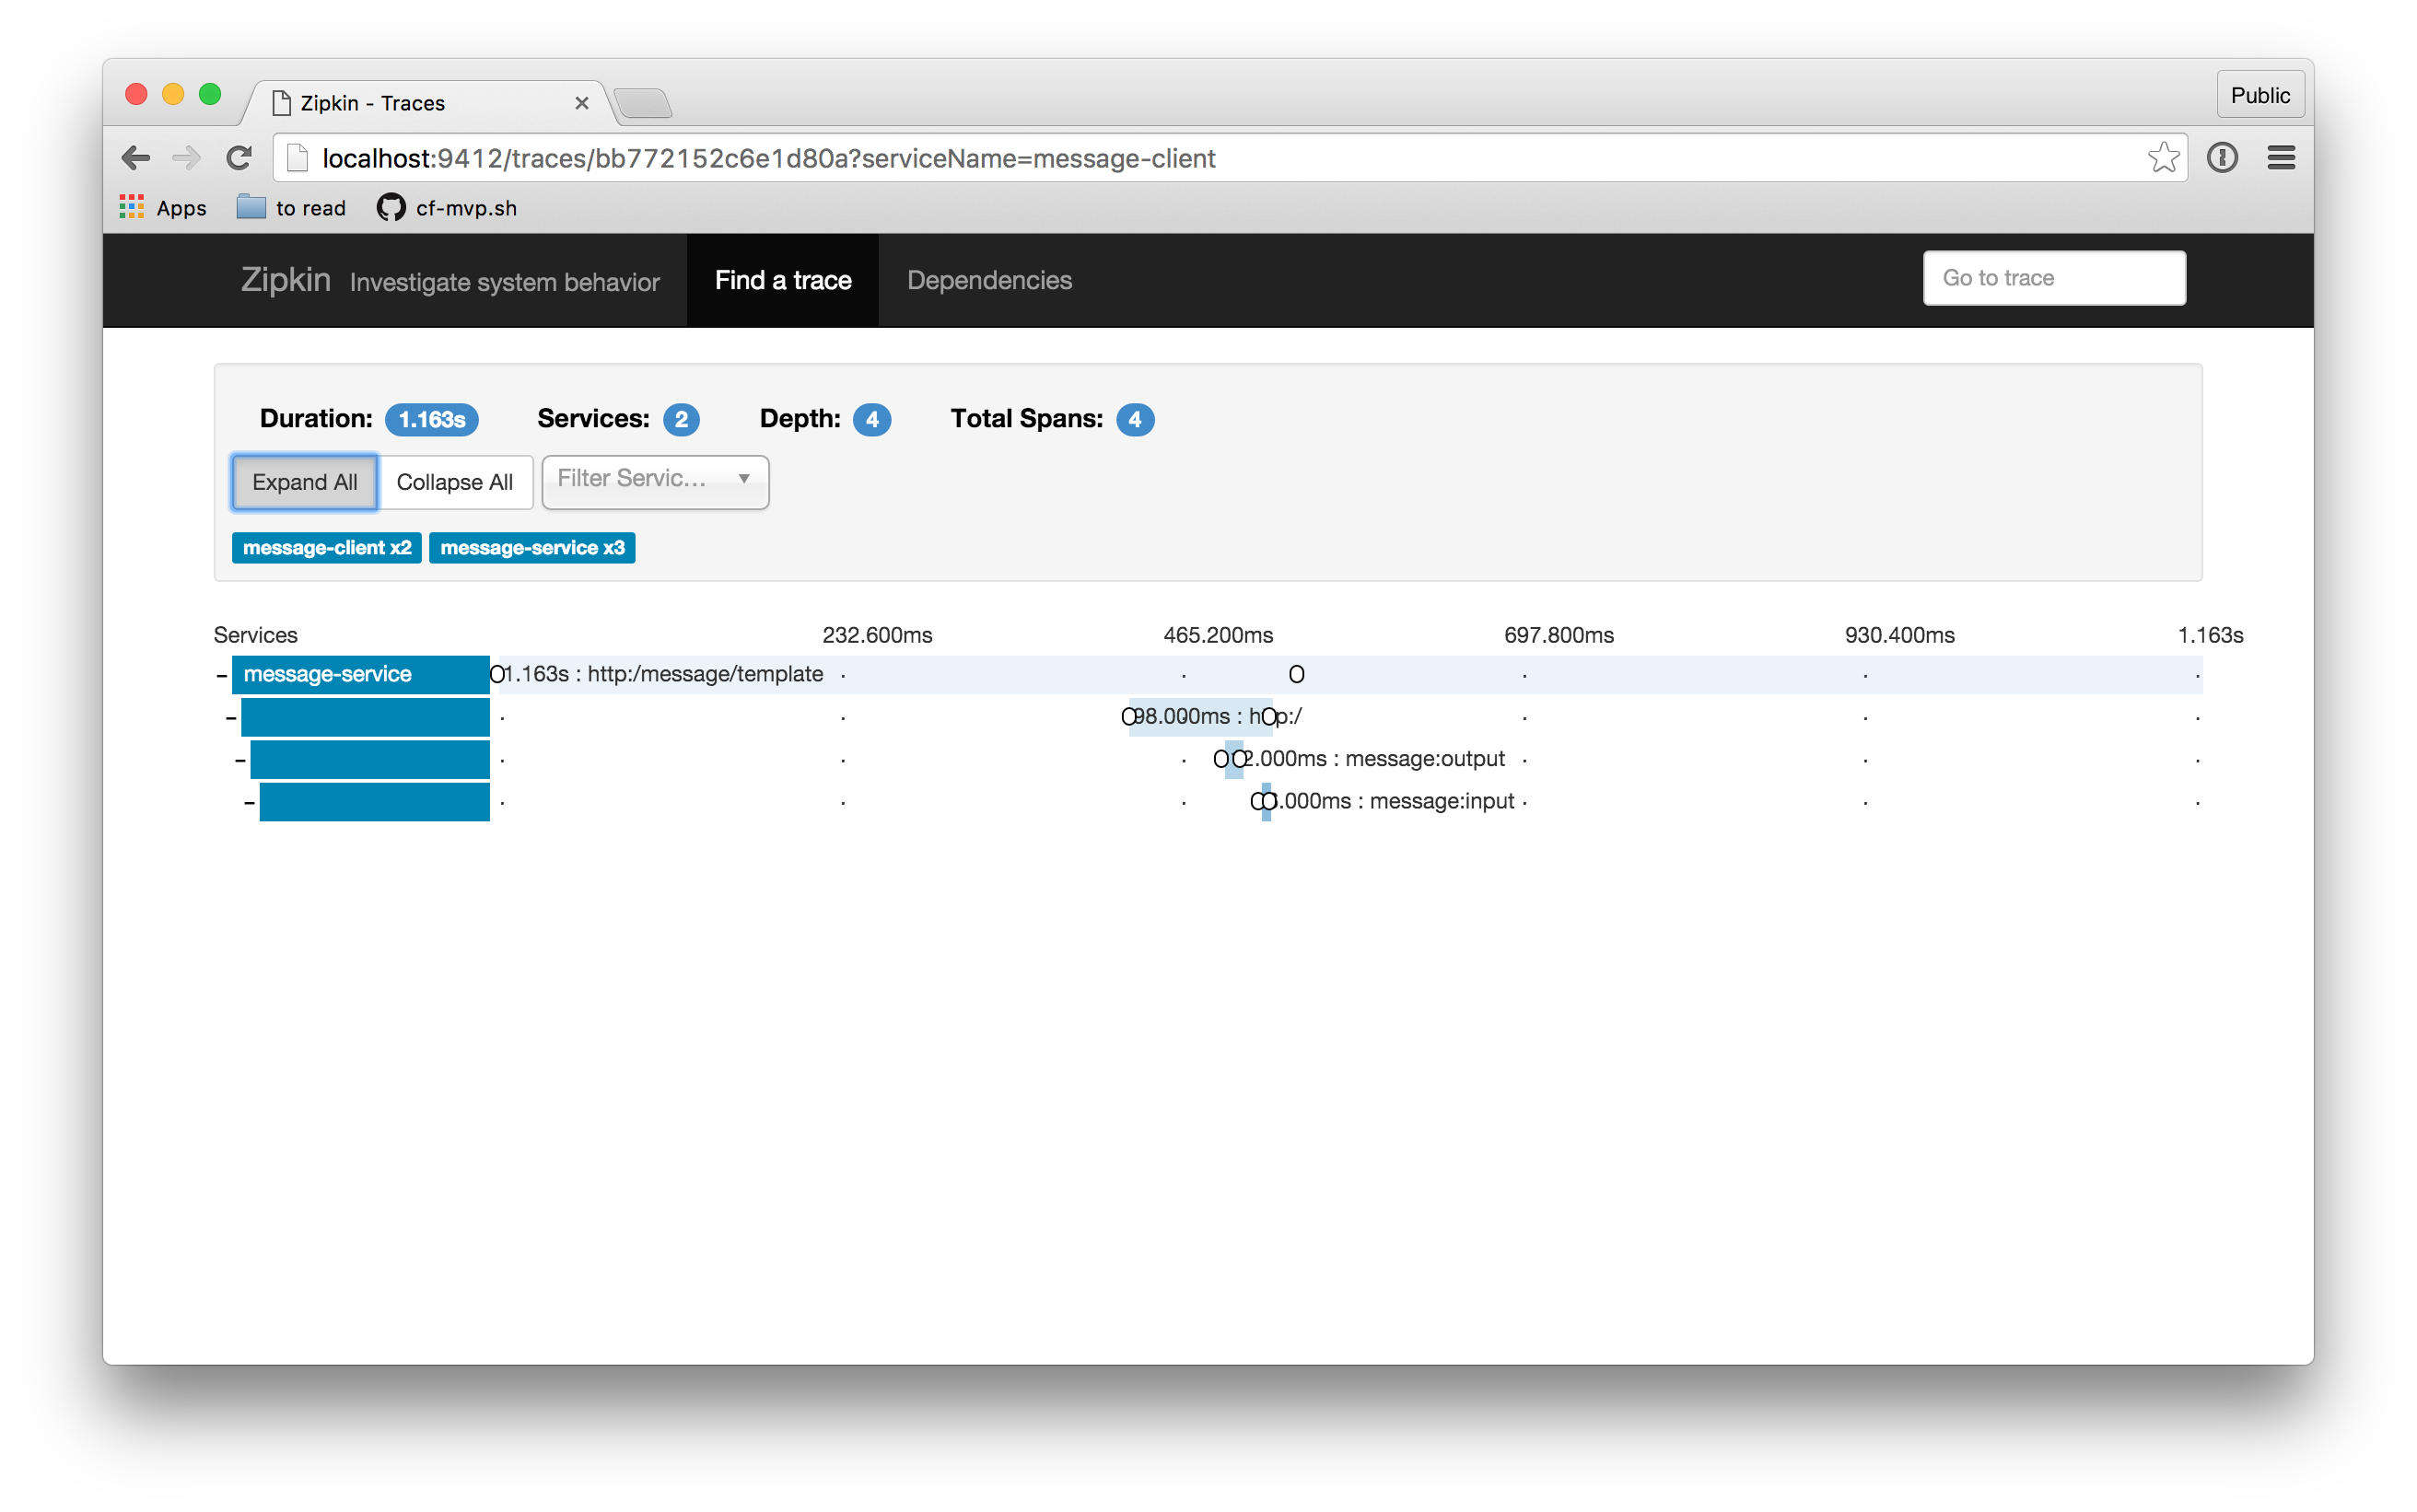
When I click on one of the traces that comes back, I get a UI that looks like this:
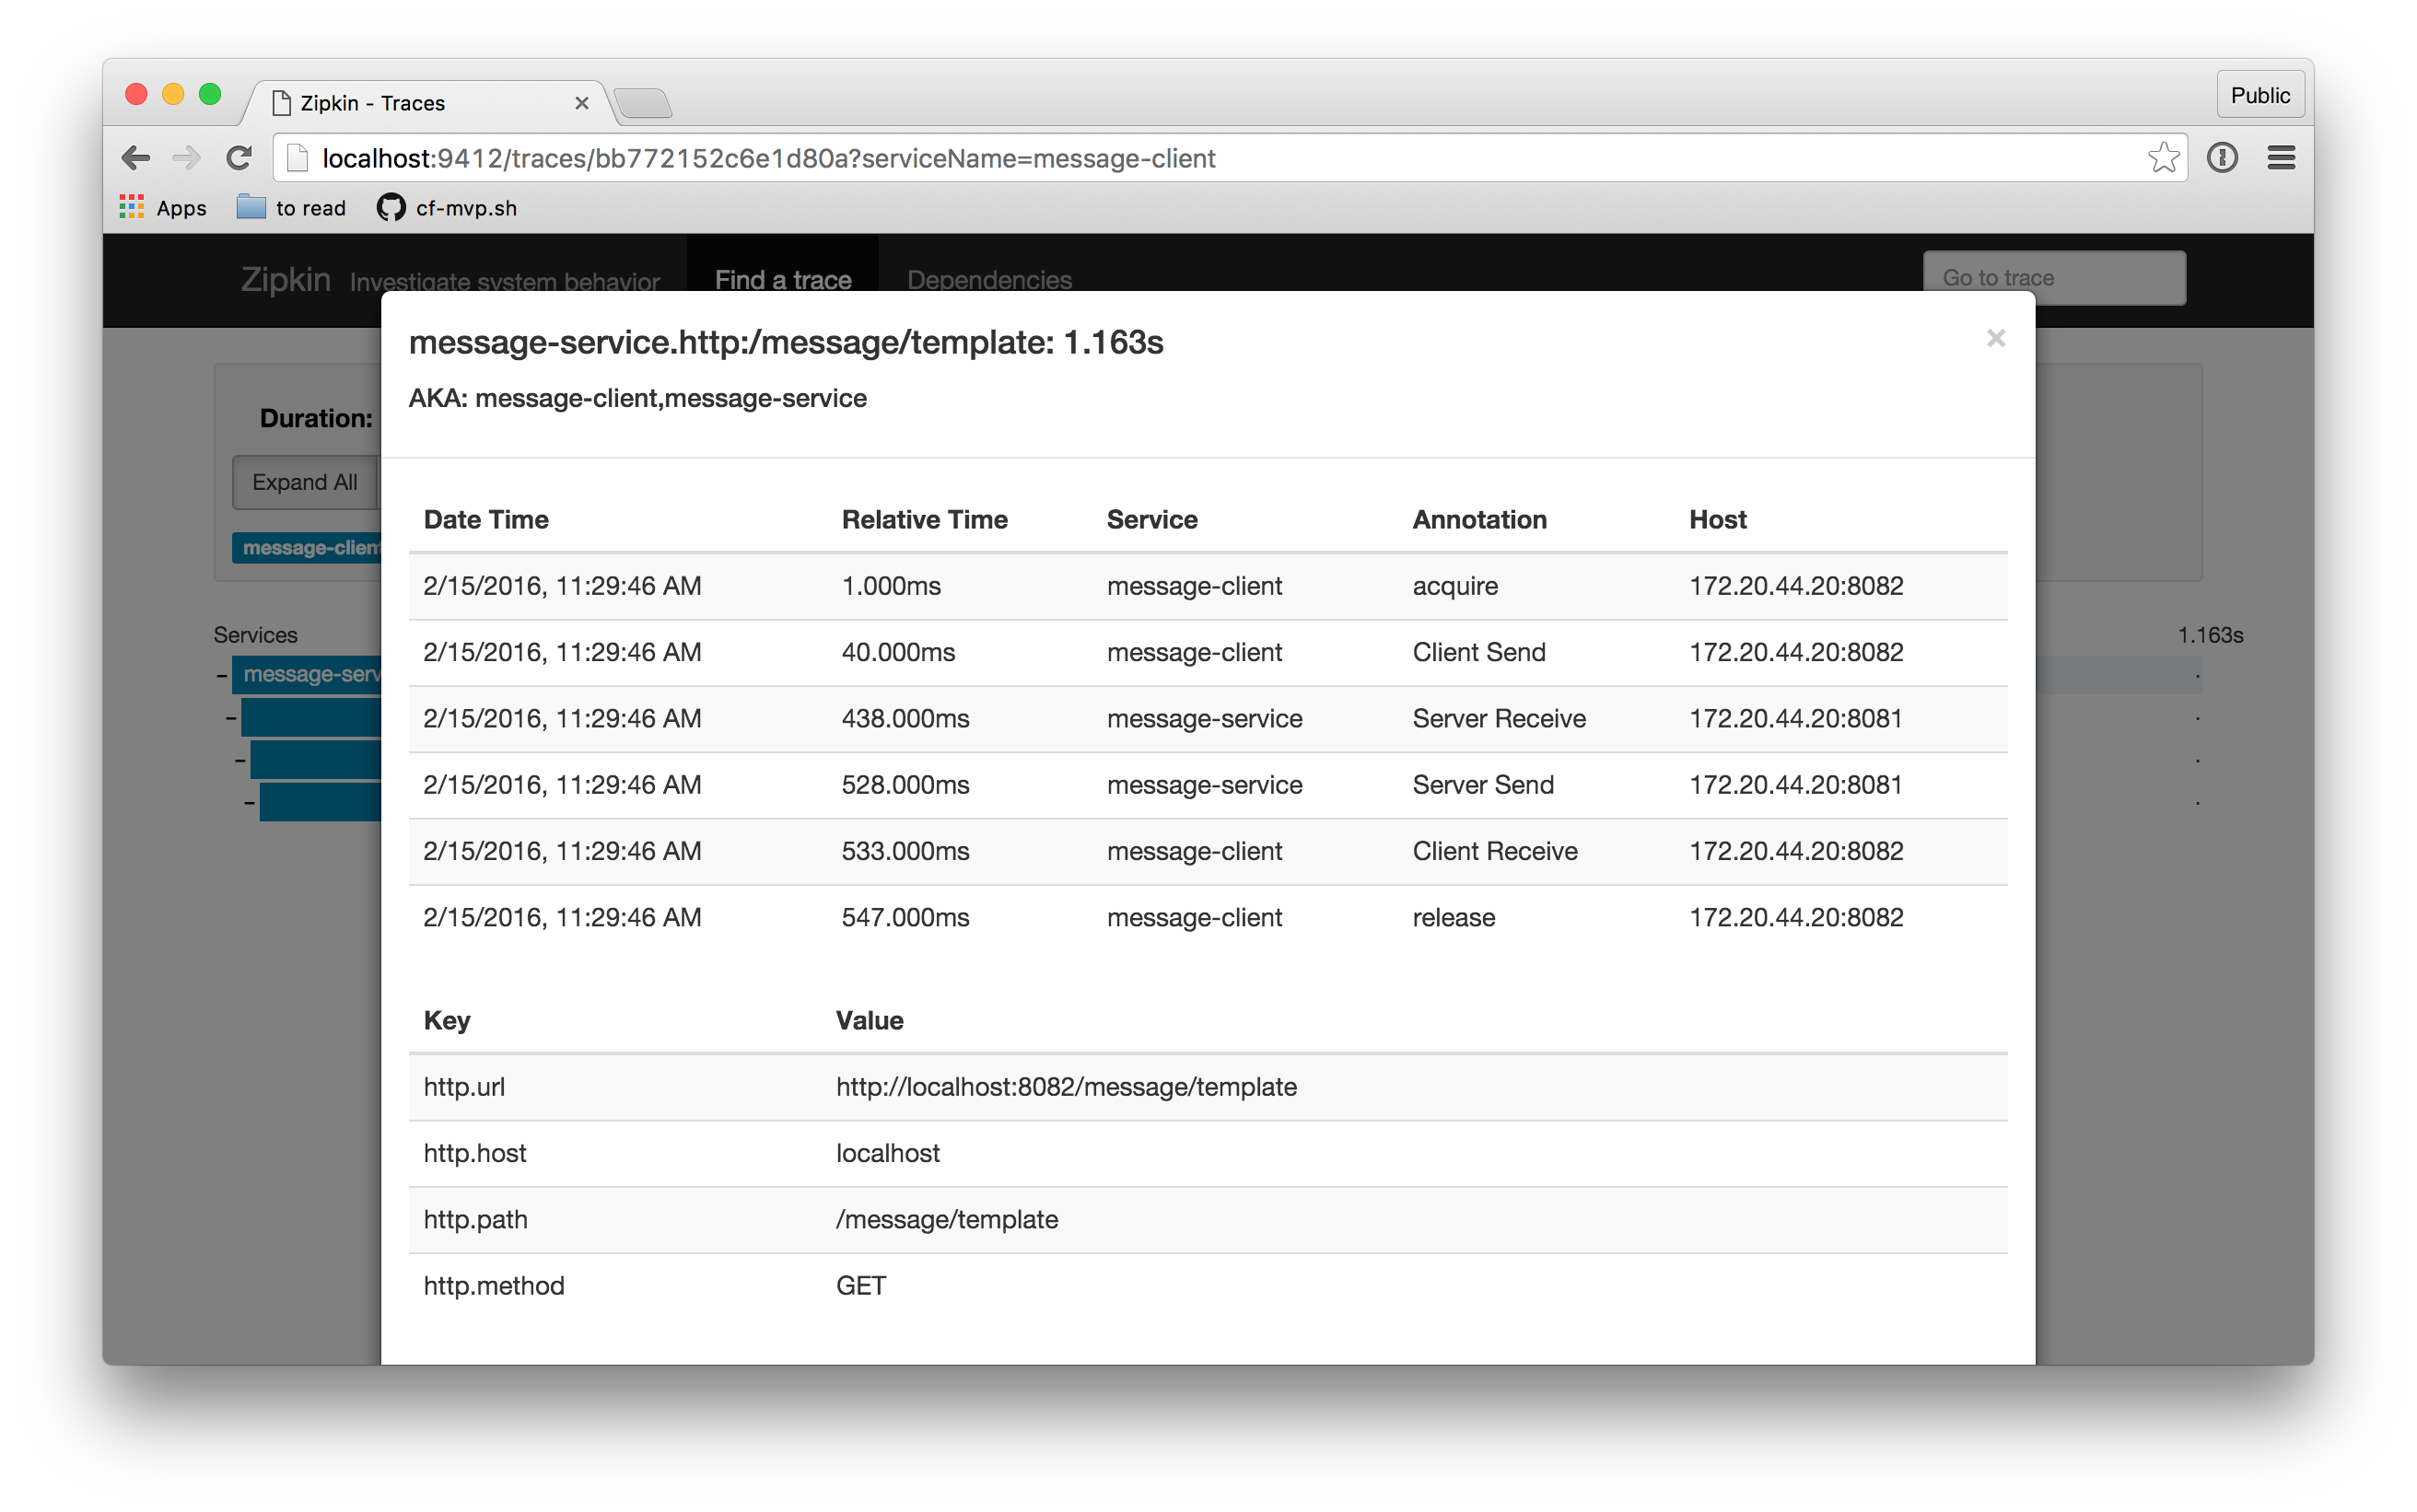
Each individual span also carries with it information (**tag**s) about the particular request with which its associated. You can view this detail by clicking on an individual span:
For Spring-based workloads, distributed tracing couldn't be easier! However, tracing, by its very nature, is a cross-cutting concern for all services no matter which technology stack they're implemented in. The OpenTracing initiative is an effort to standardize the vocabulary and concepts of modern tracing for multiple languages and platforms. The OpenTracing API has support from multiple very large organizations as its lead one of the original authors on the original Google Dapper paper. The effort defines language bindings; there are already implementations for JavaScript, Python, Go, etc. We will keep Spring Cloud Sleuth conceptually compatible with this effort and will track it. It is expected, but not implied, that the bindings will as often as not have Zipkin as their backend.
This blog was meant to skim the surface of the concepts and supporting technologies in distributed tracing. We've looked at Spring Cloud Sleuth and how Spring Cloud Sleuth works with Zipkin. Zipkin itself has an interesting supporting ecosystem. If you really want to understand what distributed tracing tools like Spring Cloud Sleuth, Zipkin, Apache's HTrace and others are modeled after, check out the original Google Dapper paper. You should check out Adrian Cole's introduction to the larger Zipkin ecosystem. Naturally, the code for this blog is also online. Finally, look no further than the Spring Initializr and add the Spring Cloud Sleuth Stream and Zipkin Stream Server to your Maven builds to get started.

VMware offers training and certification to turbo-charge your progress.
Learn moreTanzu Spring offers support and binaries for OpenJDK™, Spring, and Apache Tomcat® in one simple subscription.
Learn moreCheck out all the upcoming events in the Spring community.
View all