Get ahead
VMware offers training and certification to turbo-charge your progress.
Learn moreThe JVM can be a complex beast. Thankfully, much of that complexity is under the hood, and we as application developers and deployers often don't have to worry about it too much. With the rise of container-based deployment strategies, one area of complexity that needs some attention is the JVM's memory footprint.
The JVM divides its memory into two main categories: heap memory and non-heap memory. Heap memory is the part with which people are typically the most familiar. It's where objects that are created by the application are stored. They remain there until they are no longer referenced and are garbage collected. Typically, the amount of heap that an application is using will fluctuate as a function of the current load.
The JVM's non-heap memory is divided into several different areas. We can use the HotSpot VM's native memory tracking (NMT) to examine its memory usage across these areas. Note that, while NMT does not track all native memory usage (it does not track third party native code memory allocations, for example), it is sufficient for a large class of typical Spring applications. NMT can be used by starting the application with -XX:NativeMemoryTracking=summary and then using jcmd <pid> VM.native_memory summary to display the memory usage summary.
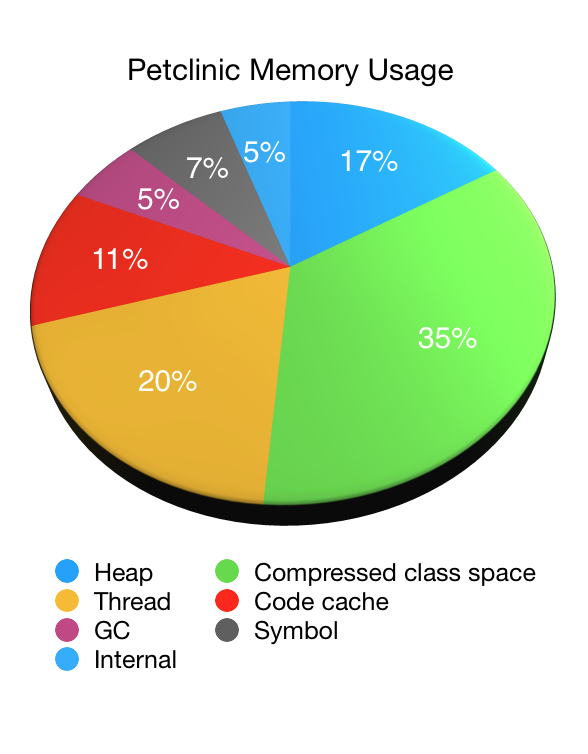
Let's illustrate the use of NMT by looking at an application, in this case our old friend, Petclinic. The following pie chart shows the JVM's memory usage as reported by NMT (minus its own overhead) when starting Petclinic with a 48MB max heap (-Xmx48M):

As you can see non-heap memory accounts for the vast majority of the JVM's memory usage with the heap memory accounting for only one sixth of the total. In this case it was roughly 44MB (with 33MB of that being used immediately after garbage collection). The non-heap memory usage was 223MB in total.
MaxMetaspaceSize. A function of the number of classes that have been loaded.ReservedCodeCacheSize. Can be reduced by tuning the JIT to, for example, disable tiered compilation.Compared to heap memory, non-heap memory is less likely to vary under load. Once an application has loaded all of the classes that it will use and the JIT is fully warmed up, things will settle into a steady state. To see a reduction in compressed class space usage, the class loader that loaded the classes needs to be garbage collected. This was more common in the past when applications were deployed to servlet containers or app servers – the application's class loader would be garbage collected when the application was undeployed – but rarely happens with modern approaches to application deployment.
Configuring the JVM to make efficient use of a given amount of available RAM isn't easy. If you launch the JVM with -Xmx16M and expect it to use, at most, 16MB of RAM you are in for a nasty surprise.
An interesting area when sizing the JVM is the JIT's code cache. By default, the HotSpot JVM will use up to 240MB. If the code cache is too small the JIT will run out of space to store its output and performance will suffer as a result. If the cache is too large, memory may be wasted. When sizing the code cache, it's important to look at the effect on both your application's memory usage and its performance.
When running in a Docker container, recent versions of Java are now aware of the container's memory limits and attempt to size the JVM accordingly. Unfortunately, this sizing often over-allocates non-heap memory and under-allocates the heap. Say you have an application running in a container with 2 CPUs and 512MB of memory available. You want it to be able to handle more load so you double the CPUs to 4 and the memory to 1GB. As we discussed above, heap usage typically varies depending on the load, and non-heap usage much less so. Therefore, we'd like the vast majority of the extra 512MB of memory to be given to the heap to cope with the increased load. Unfortunately, the JVM does not do so by default and will allocate the additional memory more equally between its heap and non-heap areas.
Thankfully, the CloudFoundry team have a wealth of knowledge about the JVM's memory footprint. If you're pushing apps to CloudFoundry, the build pack will automatically apply this knowledge for you. If you're not using CloudFoudry, or you'd like to understand more about how to size your JVM, the design document for version three of the Java buildpack's memory calculator provides some highly recommended further reading.
We spend a lot of time on the Spring team thinking about performance and memory utilisation, considering both heap and non-heap memory usage. One way to limit non-heap memory usage is to make parts of the Framework as general-purpose as possible. An example of this is the use of reflection to create and inject dependencies into your application's beans. Thanks to the use of reflection, the amount of Framework code that's used remains constant, irrespective of how many beans your application contains. We use a heap-based cache to optimise startup time, clearing this cache once startup has completed. The heap memory can then be easily reclaimed by the garbage collector, making as much memory as possible available to your application as it handles its workload.