Get ahead
VMware offers training and certification to turbo-charge your progress.
Learn moreSpring Boot has a great observability story. With the Actuator, we auto-configure Micrometer, an application metrics facade that supports numerous monitoring systems. With a few properties, you can start emitting a wide range of metrics out-of-the-box to your favorite monitoring system. And if you need to use distributed tracing, Spring Cloud Sleuth gets you covered.
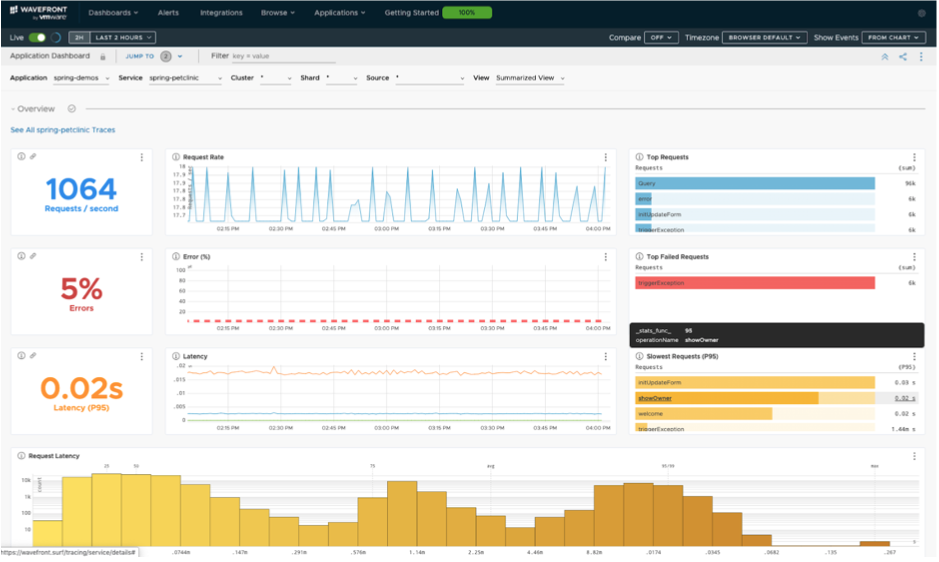
Tanzu Observability for Wavefront (formerly Wavefront) delivers scalable observability as a service where Spring developers can build analytics-driven dashboards based on multi-sourced data including metrics, traces, histograms, and span logs.
The Spring team has been working side-by-side with the Tanzu Observability team on a starter for a quick and easy way to get started. The starter also auto-provisions a free, Tanzu Observability account if you don’t already have one . The Tanzu blog has an introduction to using Wavefront with Spring and a technical deep-dive. You can also check out the documentation.

You can try out this platform by creating a new project on https://start.spring.io: select your favorite build tool, Spring Boot 2.3 and add at least the wavefront entry. You may want to select a web stack although this is not mandatory in any way.
Before starting the application, we want to make sure to identify its data later in the Tanzu Observability dashboard. Open application.properties and add the following:
wavefront.application.name=my-demo
wavefront.application.service=test
If you start such an app for the first time, you should see something like this:
A Wavefront account has been provisioned successfully and the API token has been saved to disk.

To share this account, make sure the following is added to your configuration:

	management.metrics.export.wavefront.api-token=xxxx-xxxx-xxxx-xxxx
	management.metrics.export.wavefront.uri=https://wavefront.surf

Connect to your Wavefront instance using this one-time use link:
https://wavefront.surf/us/example
An account has been auto-provisioned for you and the necessary configuration has been provided to the auto-configuration in your project. Your new api token has been saved in your home directory and will be reused automatically for any app that’s started on the same machine and user.
The single-use login URL is provided every time you start the application. If you don’t have access to the logs of your web application, you can expose the wavefront Actuator endpoint and head over /actuator/wavefront and you’ll be redirected to your Wavefront dashboard.
If you are interested in testing distributed tracing, adding Spring Cloud Sleuth (also available from start.spring.io) lets you emit traces automatically to Wavefront. You can find these in Application > Traces in your Wavefront dashboard. The Tanzu Observability platform supports other flavors of distributed tracing as well. To learn more about it, check out the documentation.
The Wavefront Spring Boot starter is in the release candidate phase and we’d love to hear from you. Head over https://start.spring.io, create a new project with Wavefront and Spring Boot 2.3 and let us know if you find any problem.