Get ahead
VMware offers training and certification to turbo-charge your progress.
Learn moreWith the release of the Spring Cloud 2021.0.0 (aka Jubilee) release train we're more than happy to announce the general availability of Spring Cloud Sleuth 3.1.0. In this blog post we'll describe the most notable released features.
Here is the list of most notable features, we'll elaborate on them in the subsequent parts of this post.
We’re decorating DataSources in a trace representation. We delegate actual proxying to either p6spy or datasource-proxy. In order to use this feature you need to have them on the classpath.
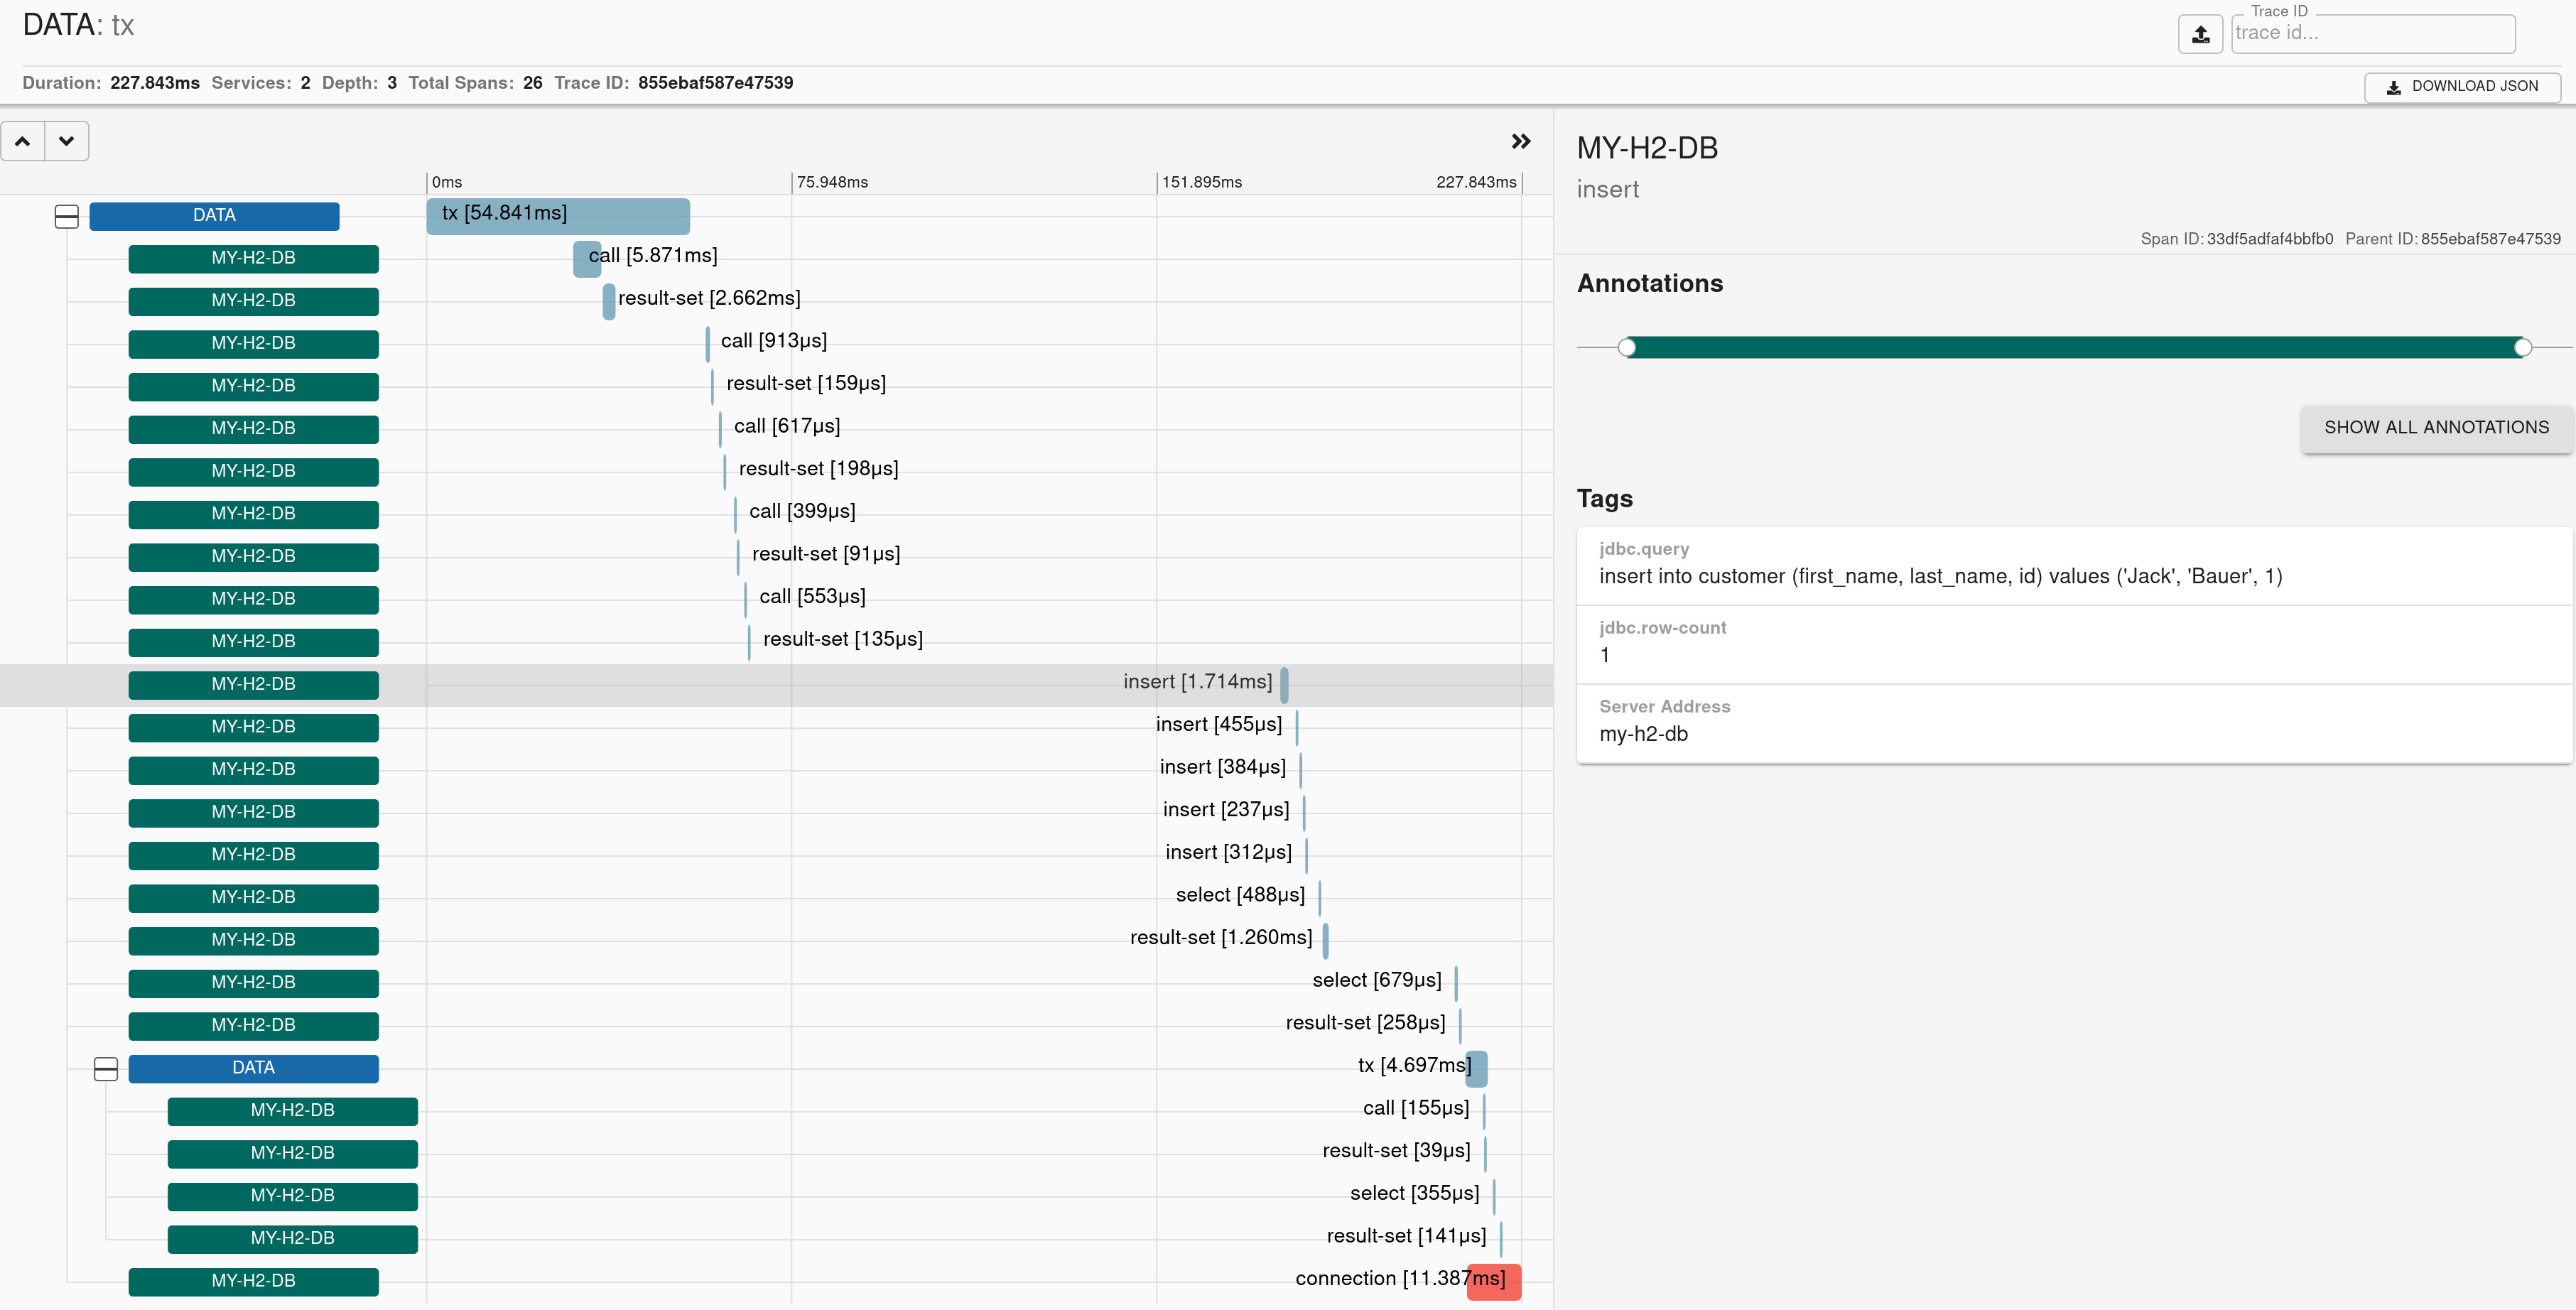
Check the docs for more details.
Here you can find a sample that depicts this integration.
The main driver behind this change is that up till Sleuth 3.1 your Tomcat logs wouldn't have any tracing information in it. With this change we're instrumenting Tomcat, so we're far earlier in the lifecycle of the request and we can instrument all possible logs with tracing information.
Check the docs for more details.
Here you can find a sample that depicts this integration.
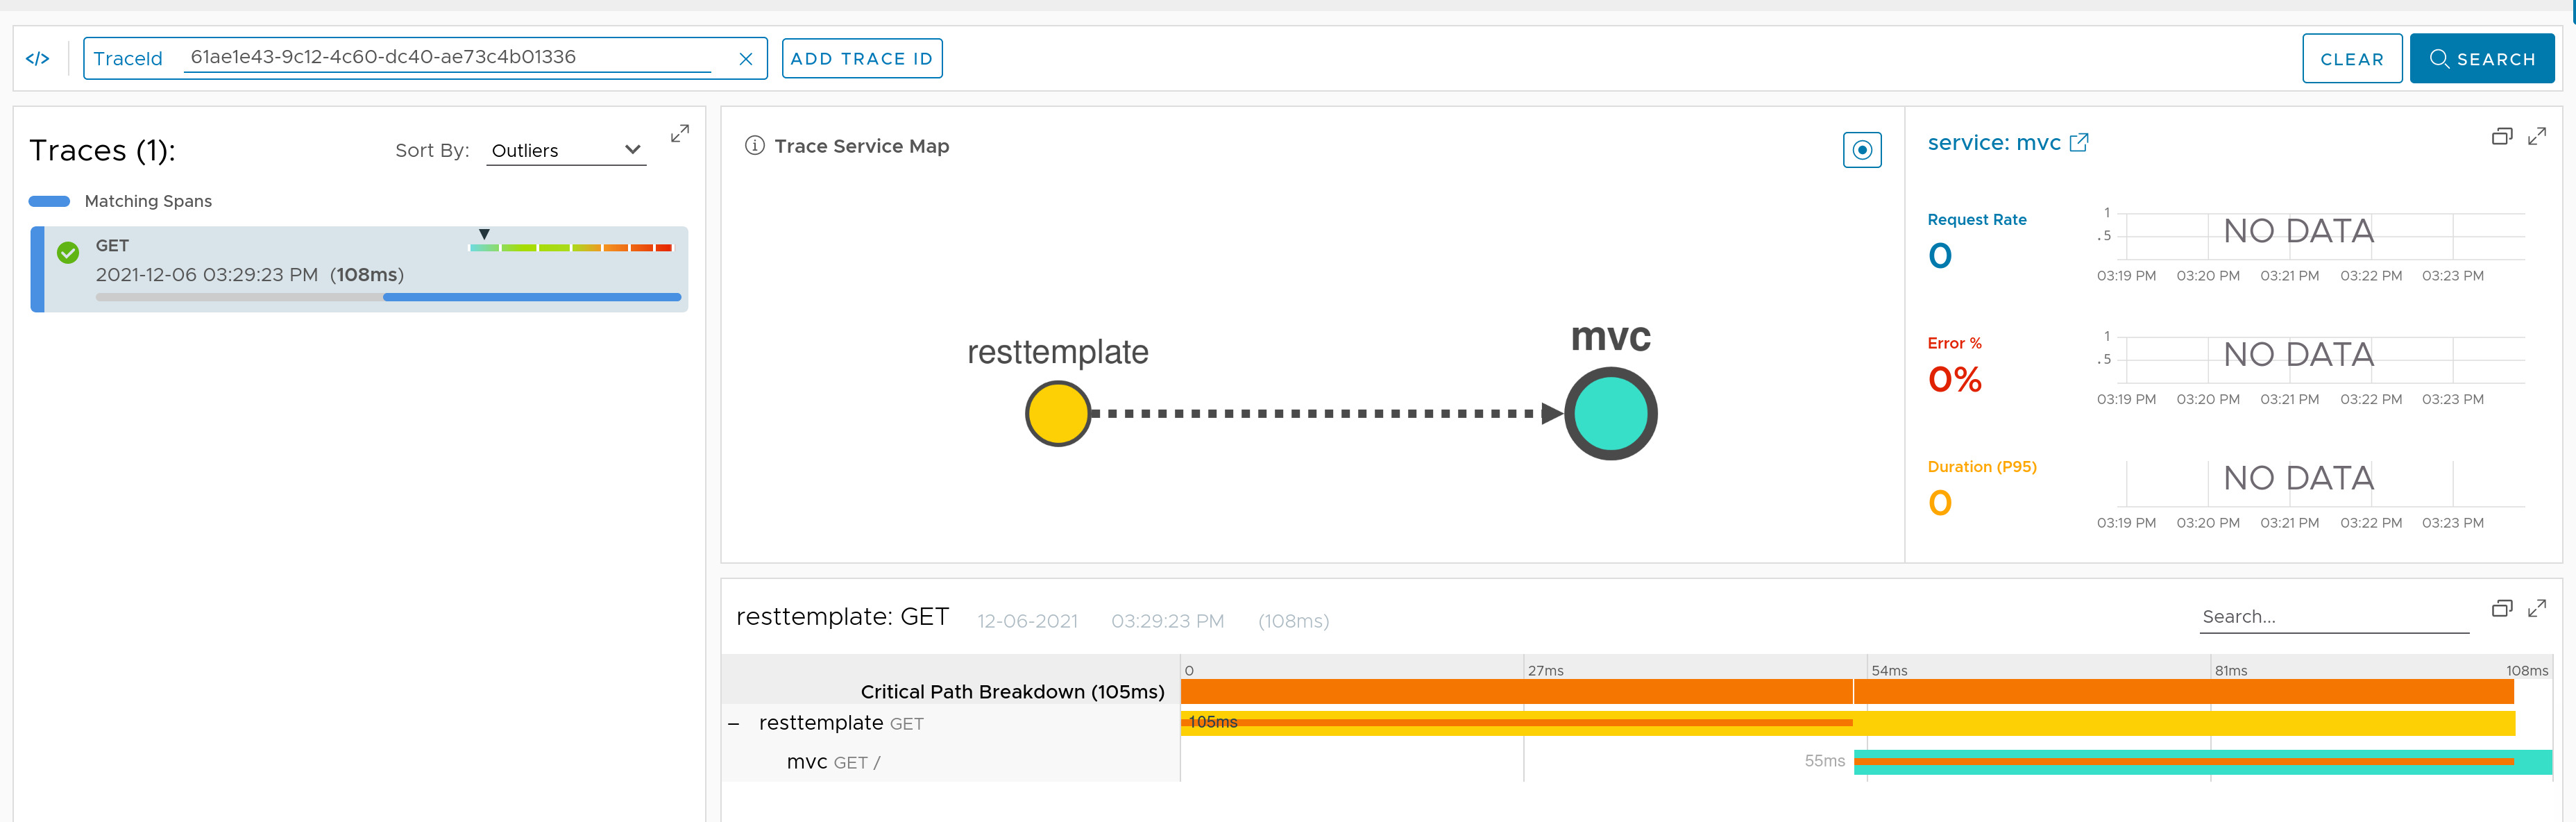
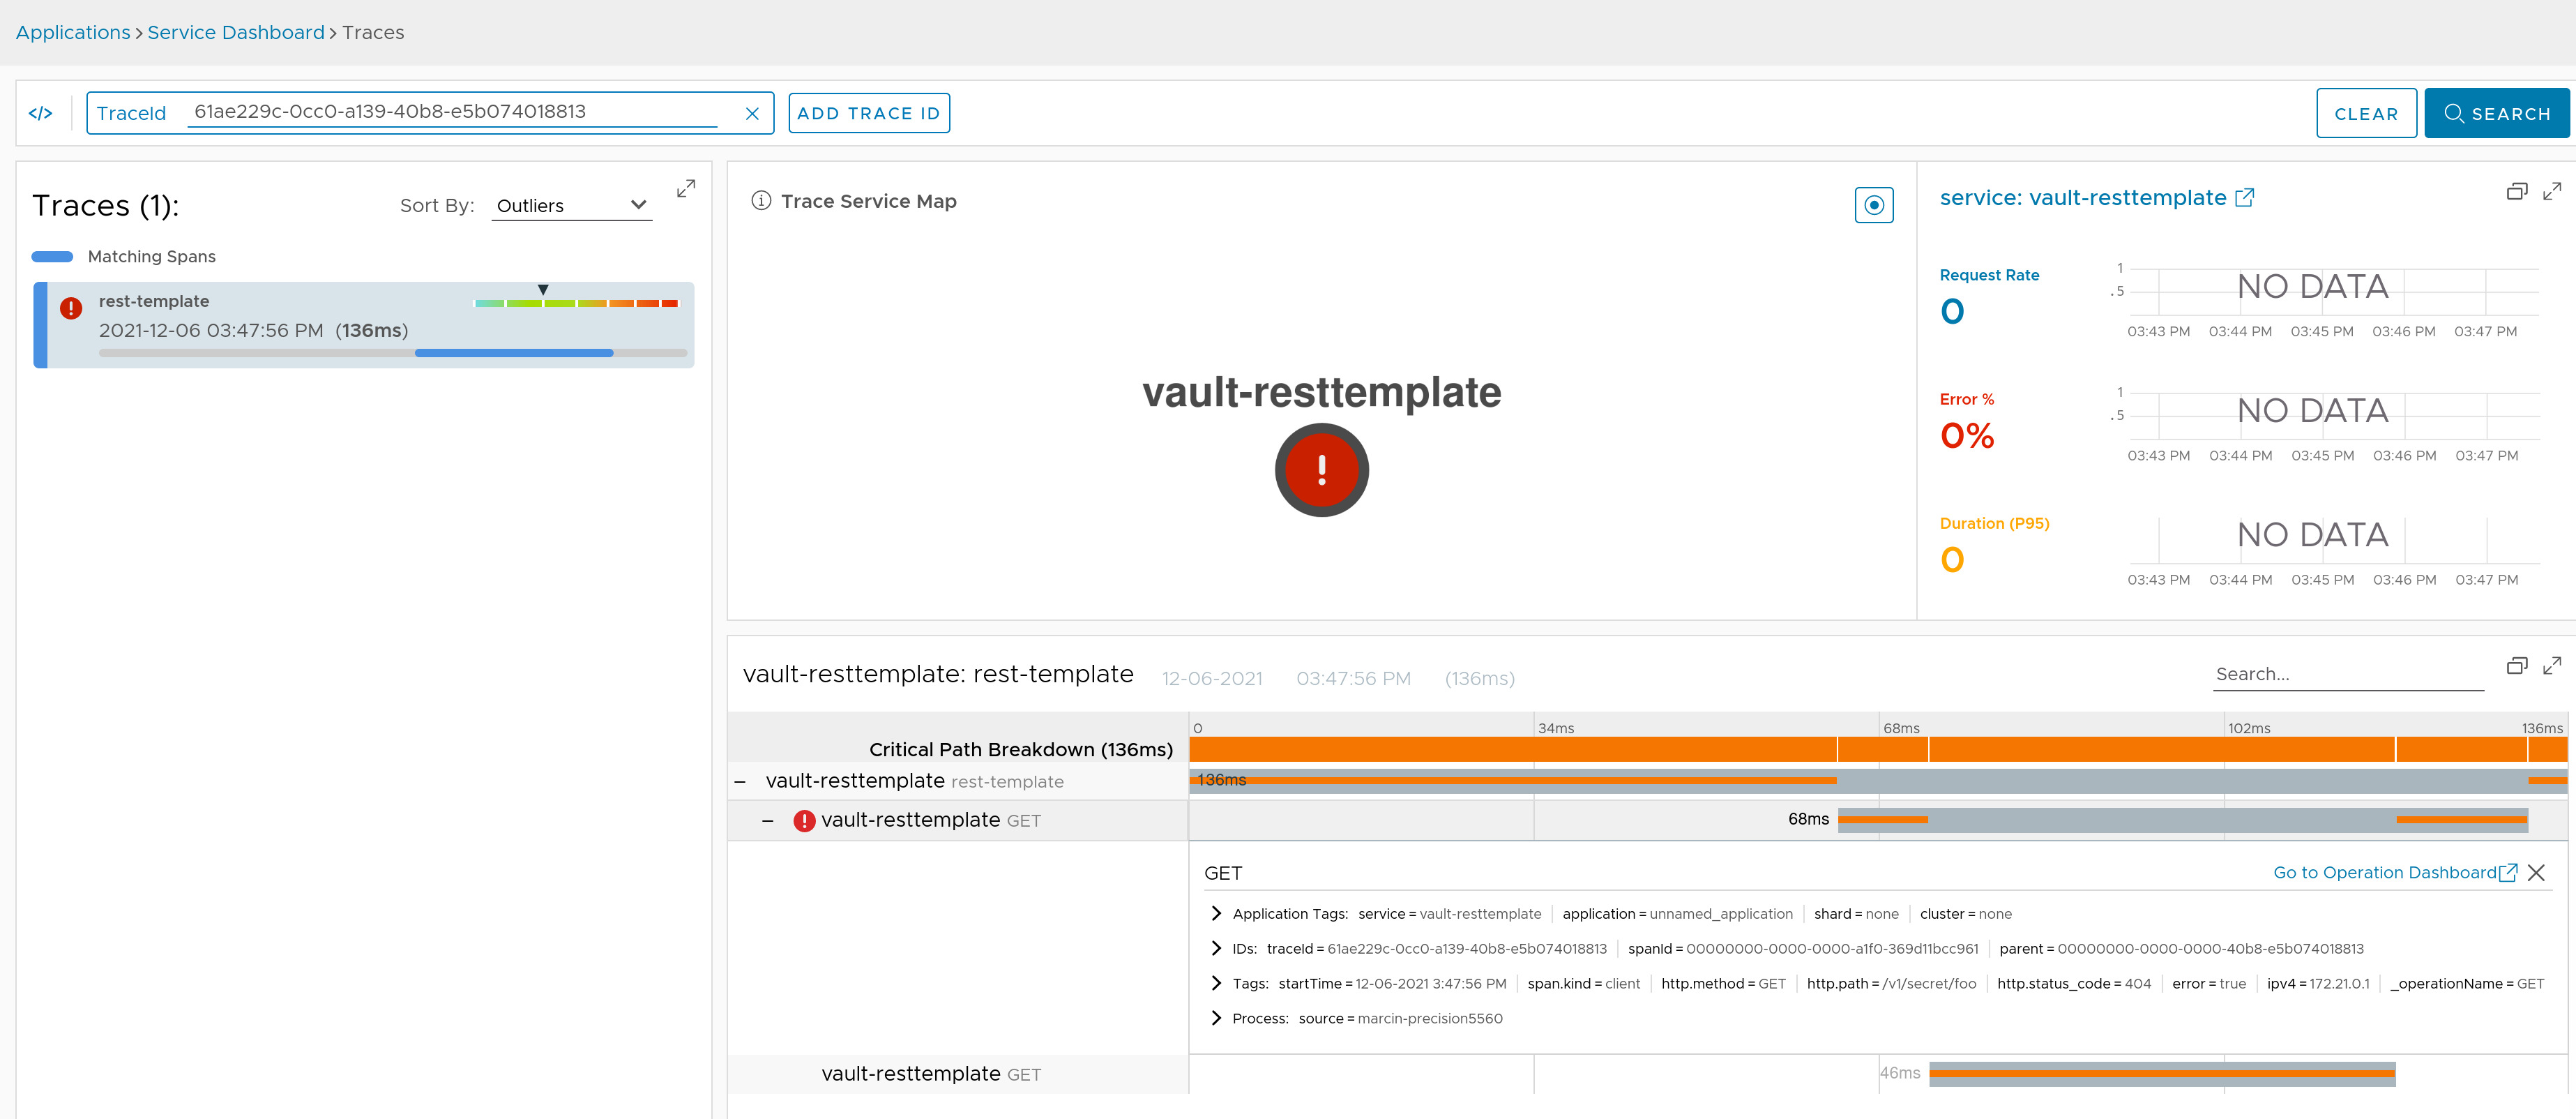
We’re instrumenting the RestTemplate or WebClient instances used by Spring Vault to communicate with Vault.
Check the docs for more details.
Here you can find a sample that depicts this integration for RestTemplate.
Here you can find a sample that depicts this integration for WebClient.
There's nothing more frustrating in the tracing world than creating a span and not starting it, or not stopping it. We had enough of such situations... Another challenge we faced was that we didn't even remember any longer how many spans we create, what their names are and how many tags / events are being set on them.
We've decided to alter the way we code things in Sleuth so that we can introduce certain automation. We are instrumenting the code once, however we are able to turn on at the test time additional assertions that verify if spans were started and stopped etc. Also at the documentation build time we parse the sources and build a table of spans together with some details.
You can check the docs to see the results of that automation.
If you have Spring Cloud Deployer running on the classpath, we wrap the AppDeployer in a trace representation. We are polling the application for its status at a default interval.
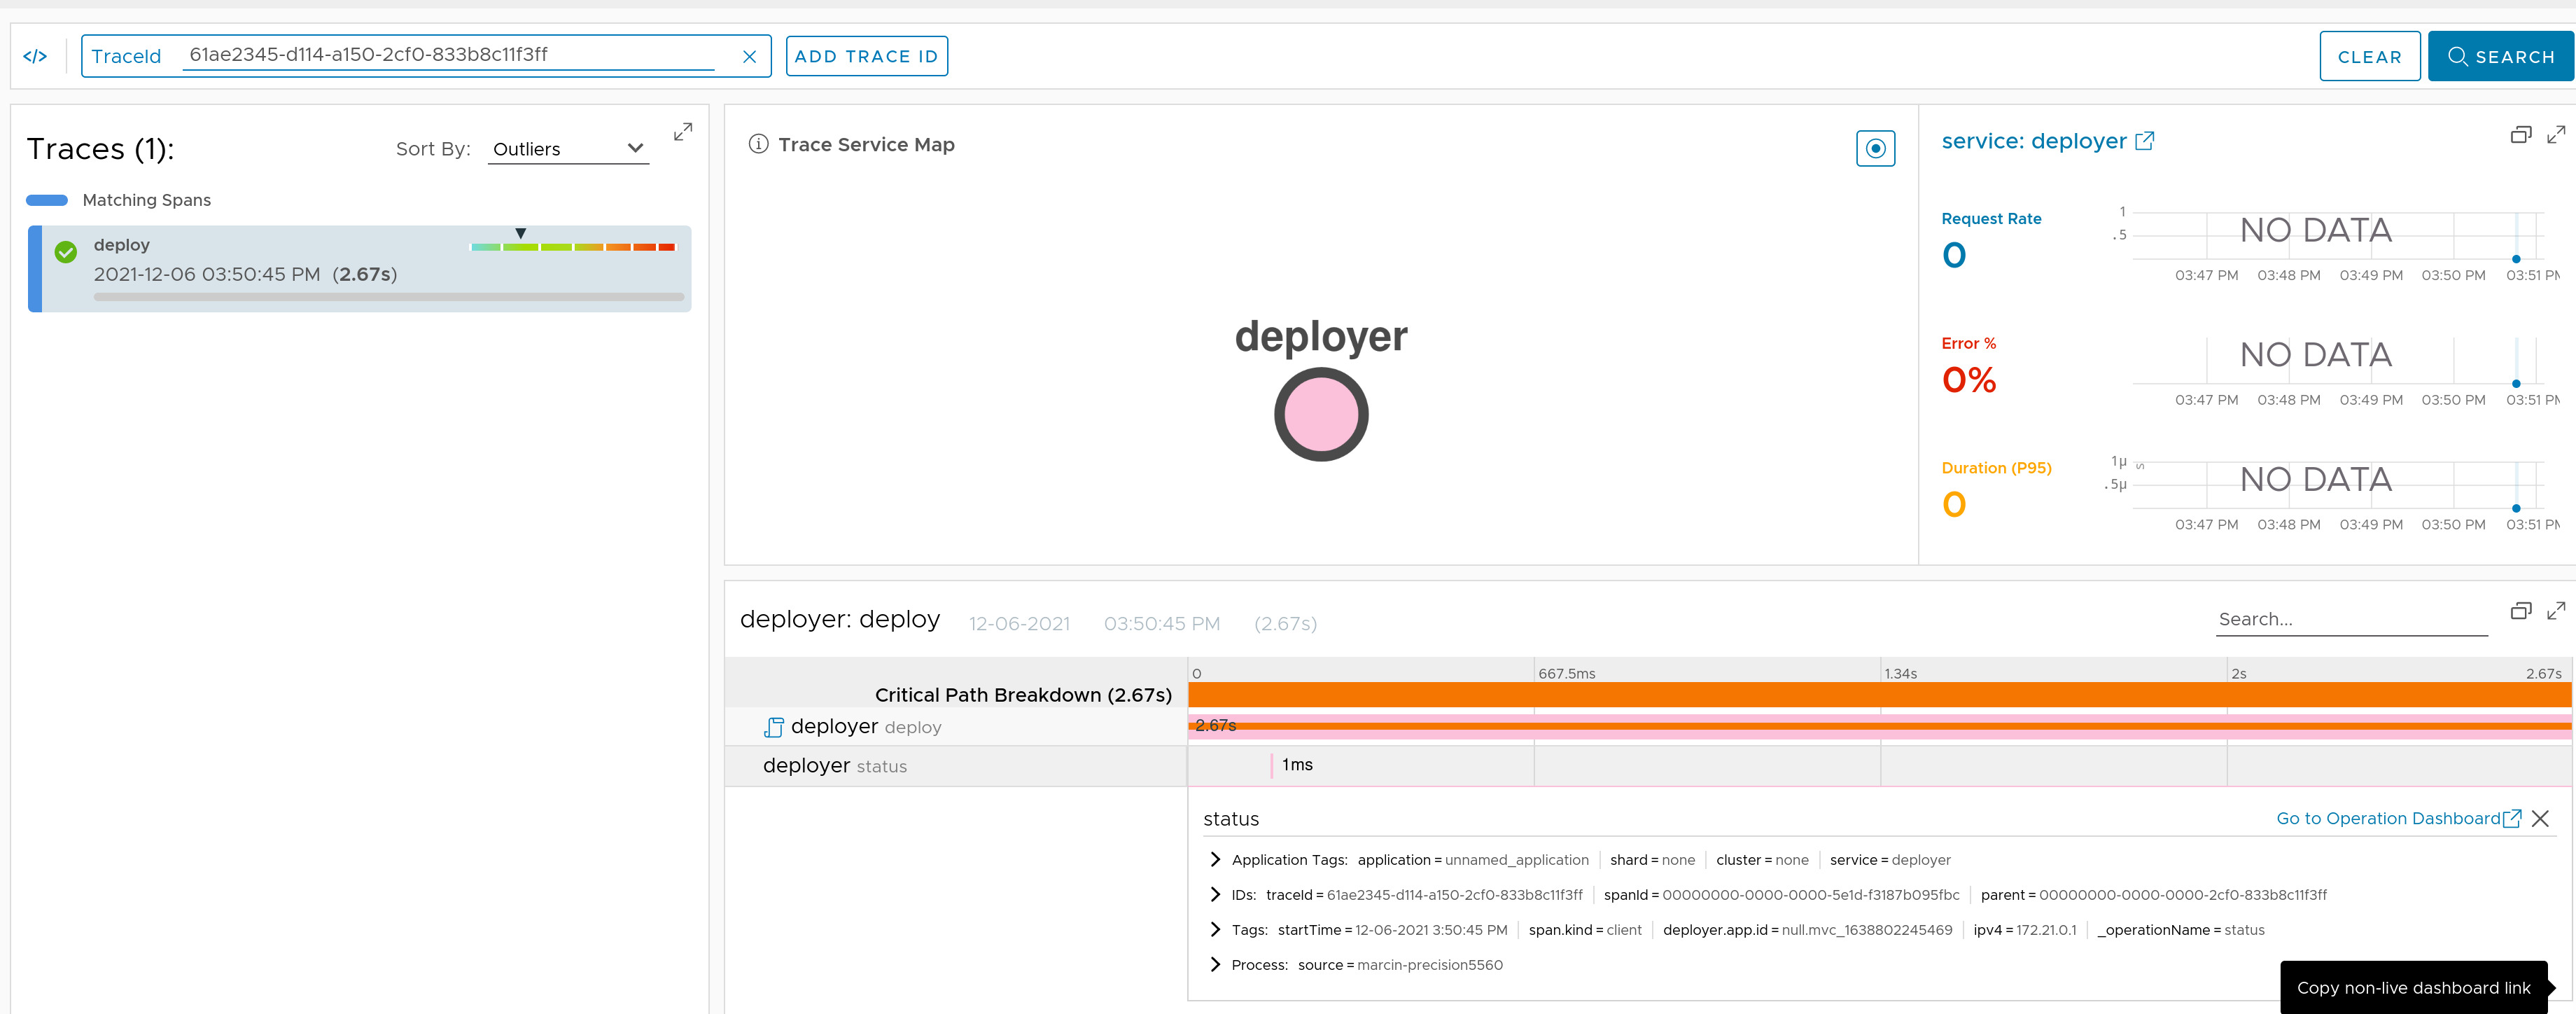
Check the docs for more details.
Here you can find a sample that depicts this integration.
If you have R2DBC Proxy on the classpath we will instrument the ConnectionFactory so that it contains a custom ProxyExecutionListener.

Check the docs for more details.
Here you can find a sample that depicts this integration.
We decorate the Kafka clients (KafkaProducer and KafkaConsumer) to create a span for each event that is produced or consumed. We also provide TracingKafkaProducerFactory and TracingKafkaConsumerFactory to be used with the Reactor Kafka clients (KafkaSender and KafkaReceiver, respectively). Additionally, we decorate any Spring Kafka ProducerFactory and ConsumerFactory available in the context.
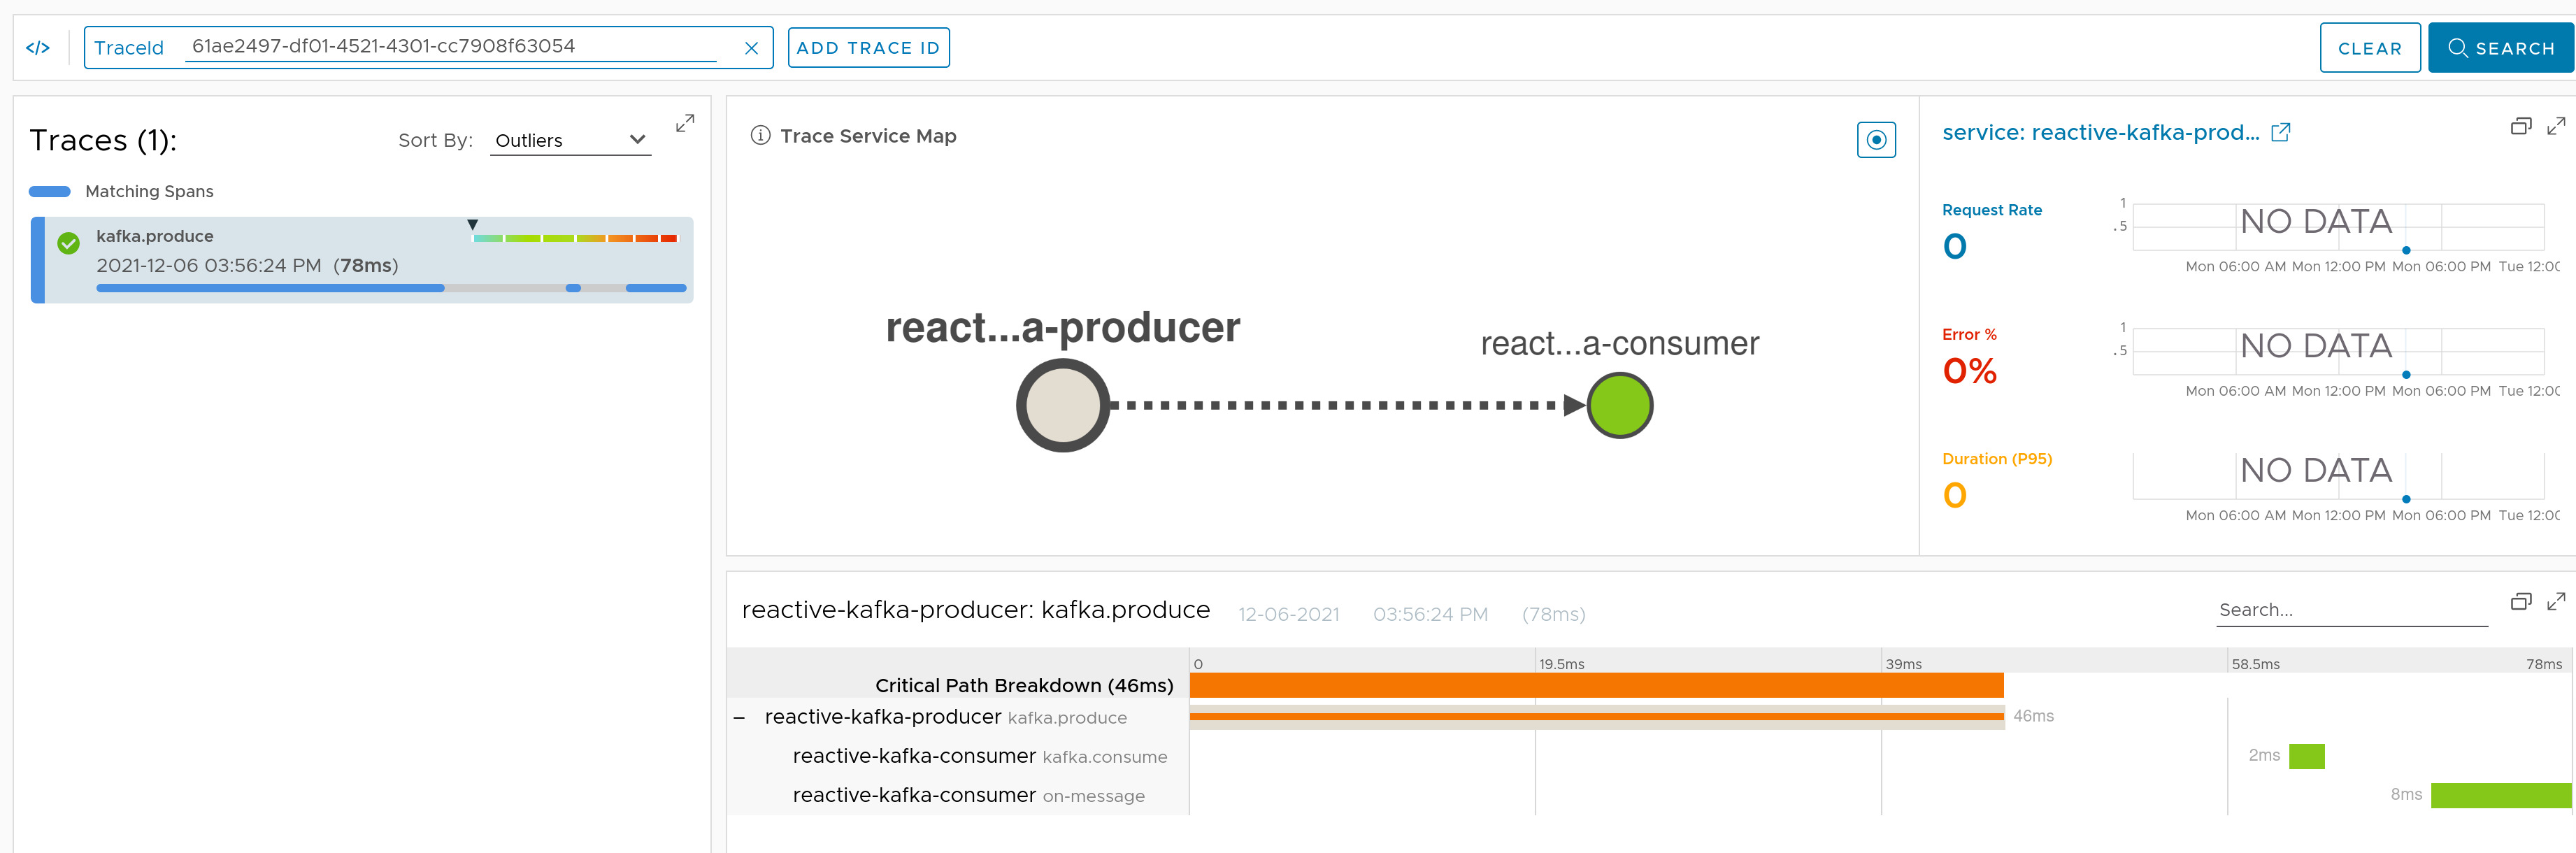
Check the docs for more details.
Here you can find a sample that depicts this integration for Kafka producer.
Here you can find a sample that depicts this integration for Kafka consumer.
Here you can find a sample that depicts this integration for Kafka Reactive producer.
Here you can find a sample that depicts this integration for Kafka Reactive consumer.
If you have Spring Tx on the classpath we will instrument the PlatformTransactionManager and the ReactiveTransactionManager to create a span whenever a new transaction is created.
Check the docs for more details.
Here you can find a sample that depicts this integration.
If you have Spring Batch running on the classpath, we wrap the StepBuilderFactory and the JobBuilderFactory to propagate the tracing context.
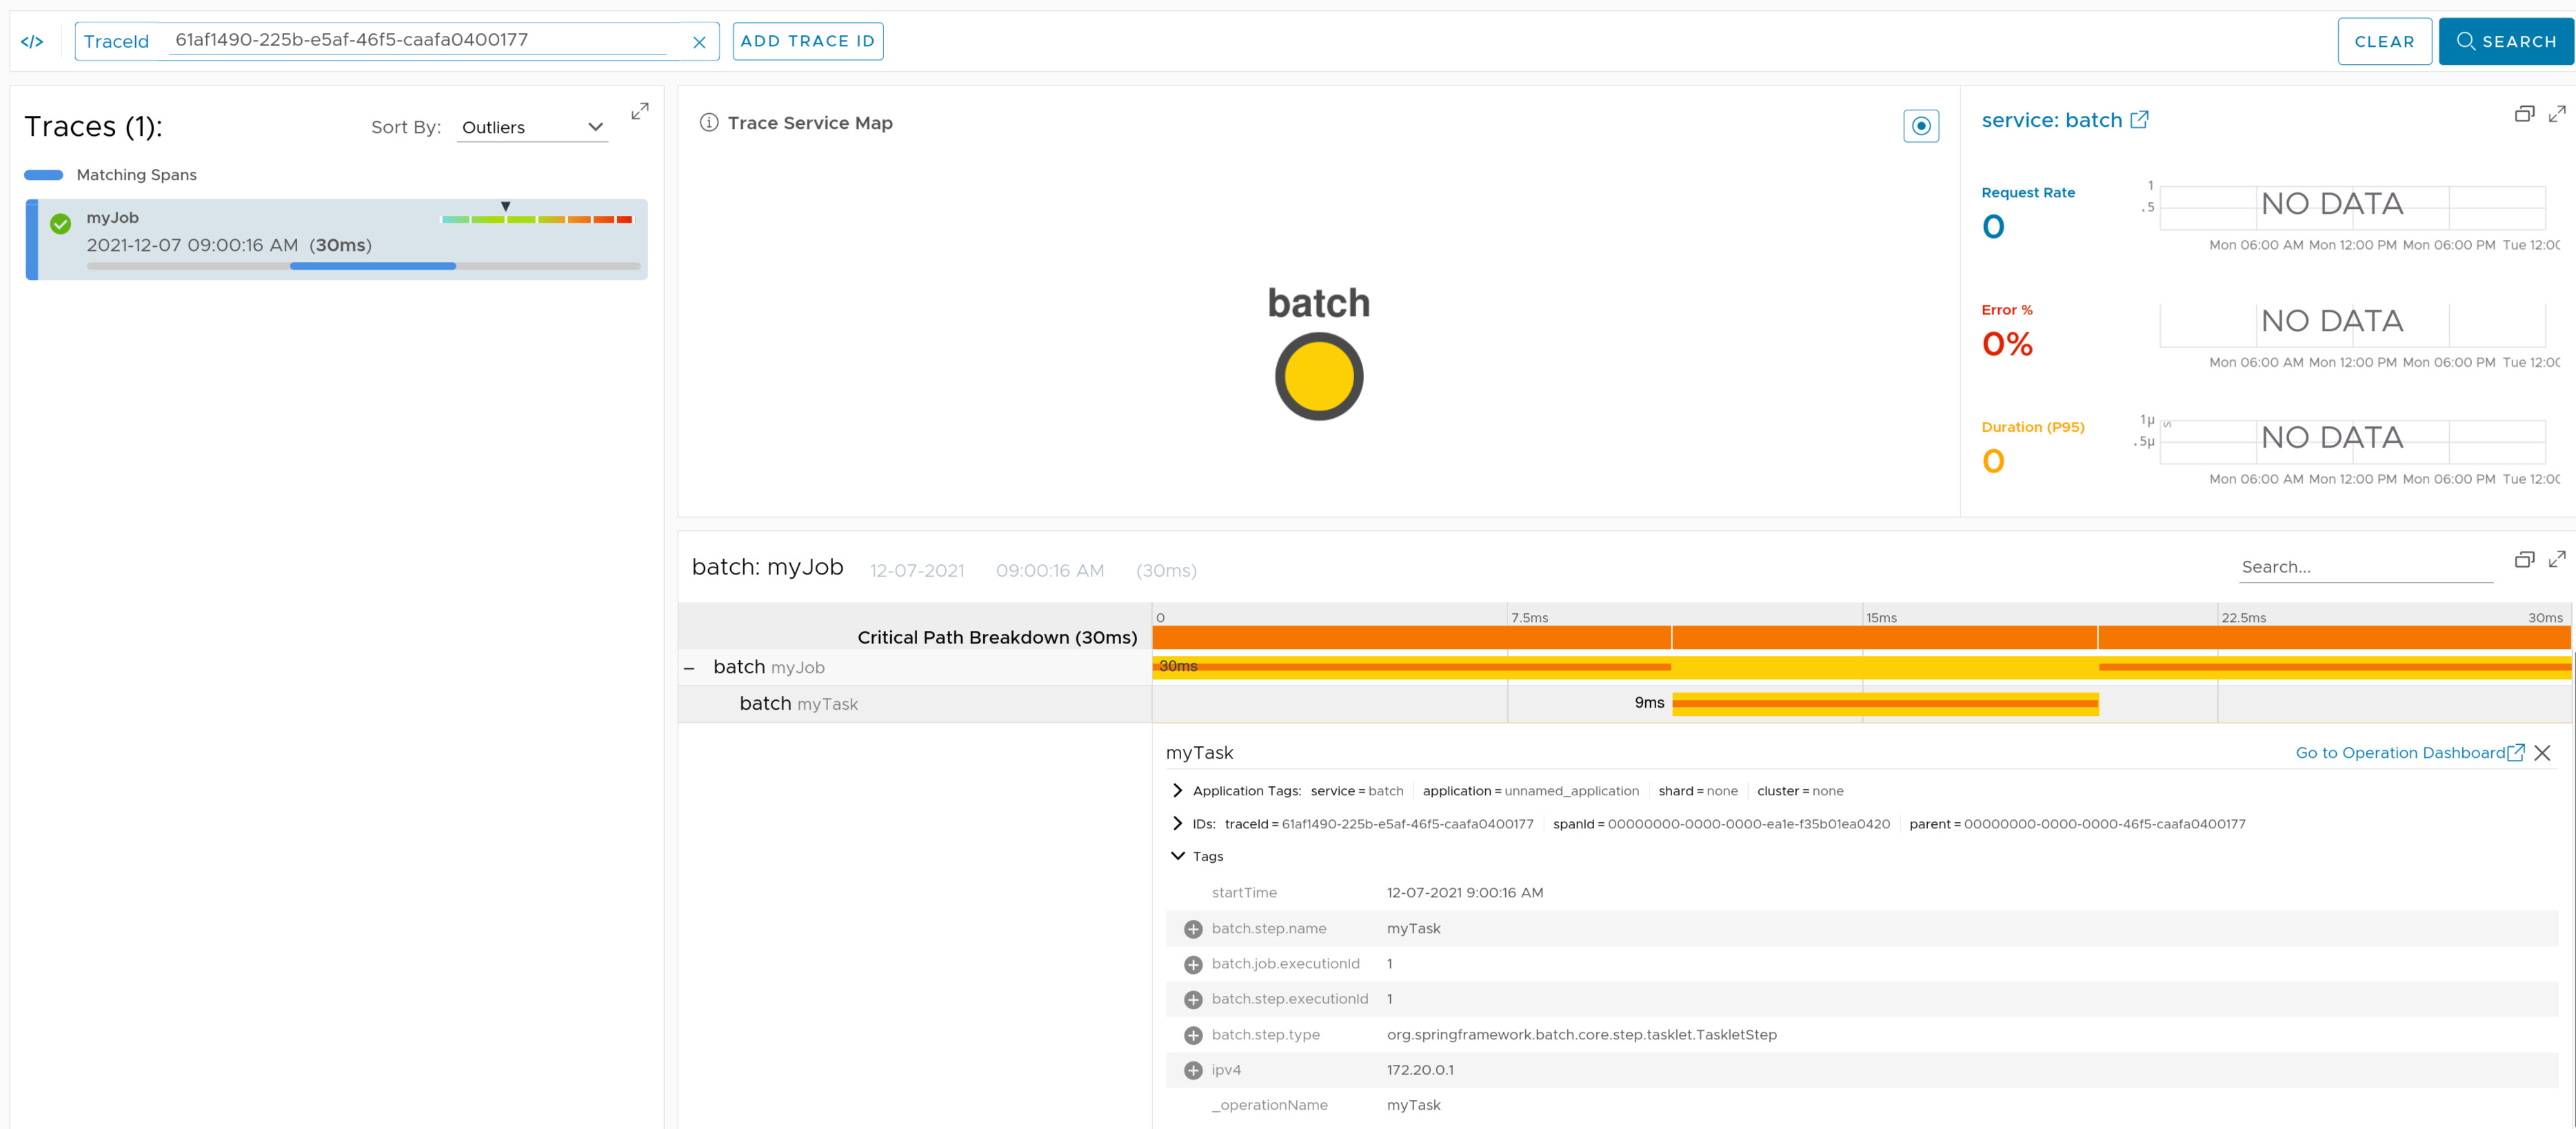
Check the docs for more details.
Here you can find a sample that depicts this integration.
If you have Spring RSocket running on the classpath, we wrap the inbound and outbound communication to propagate the tracing context via the metadata
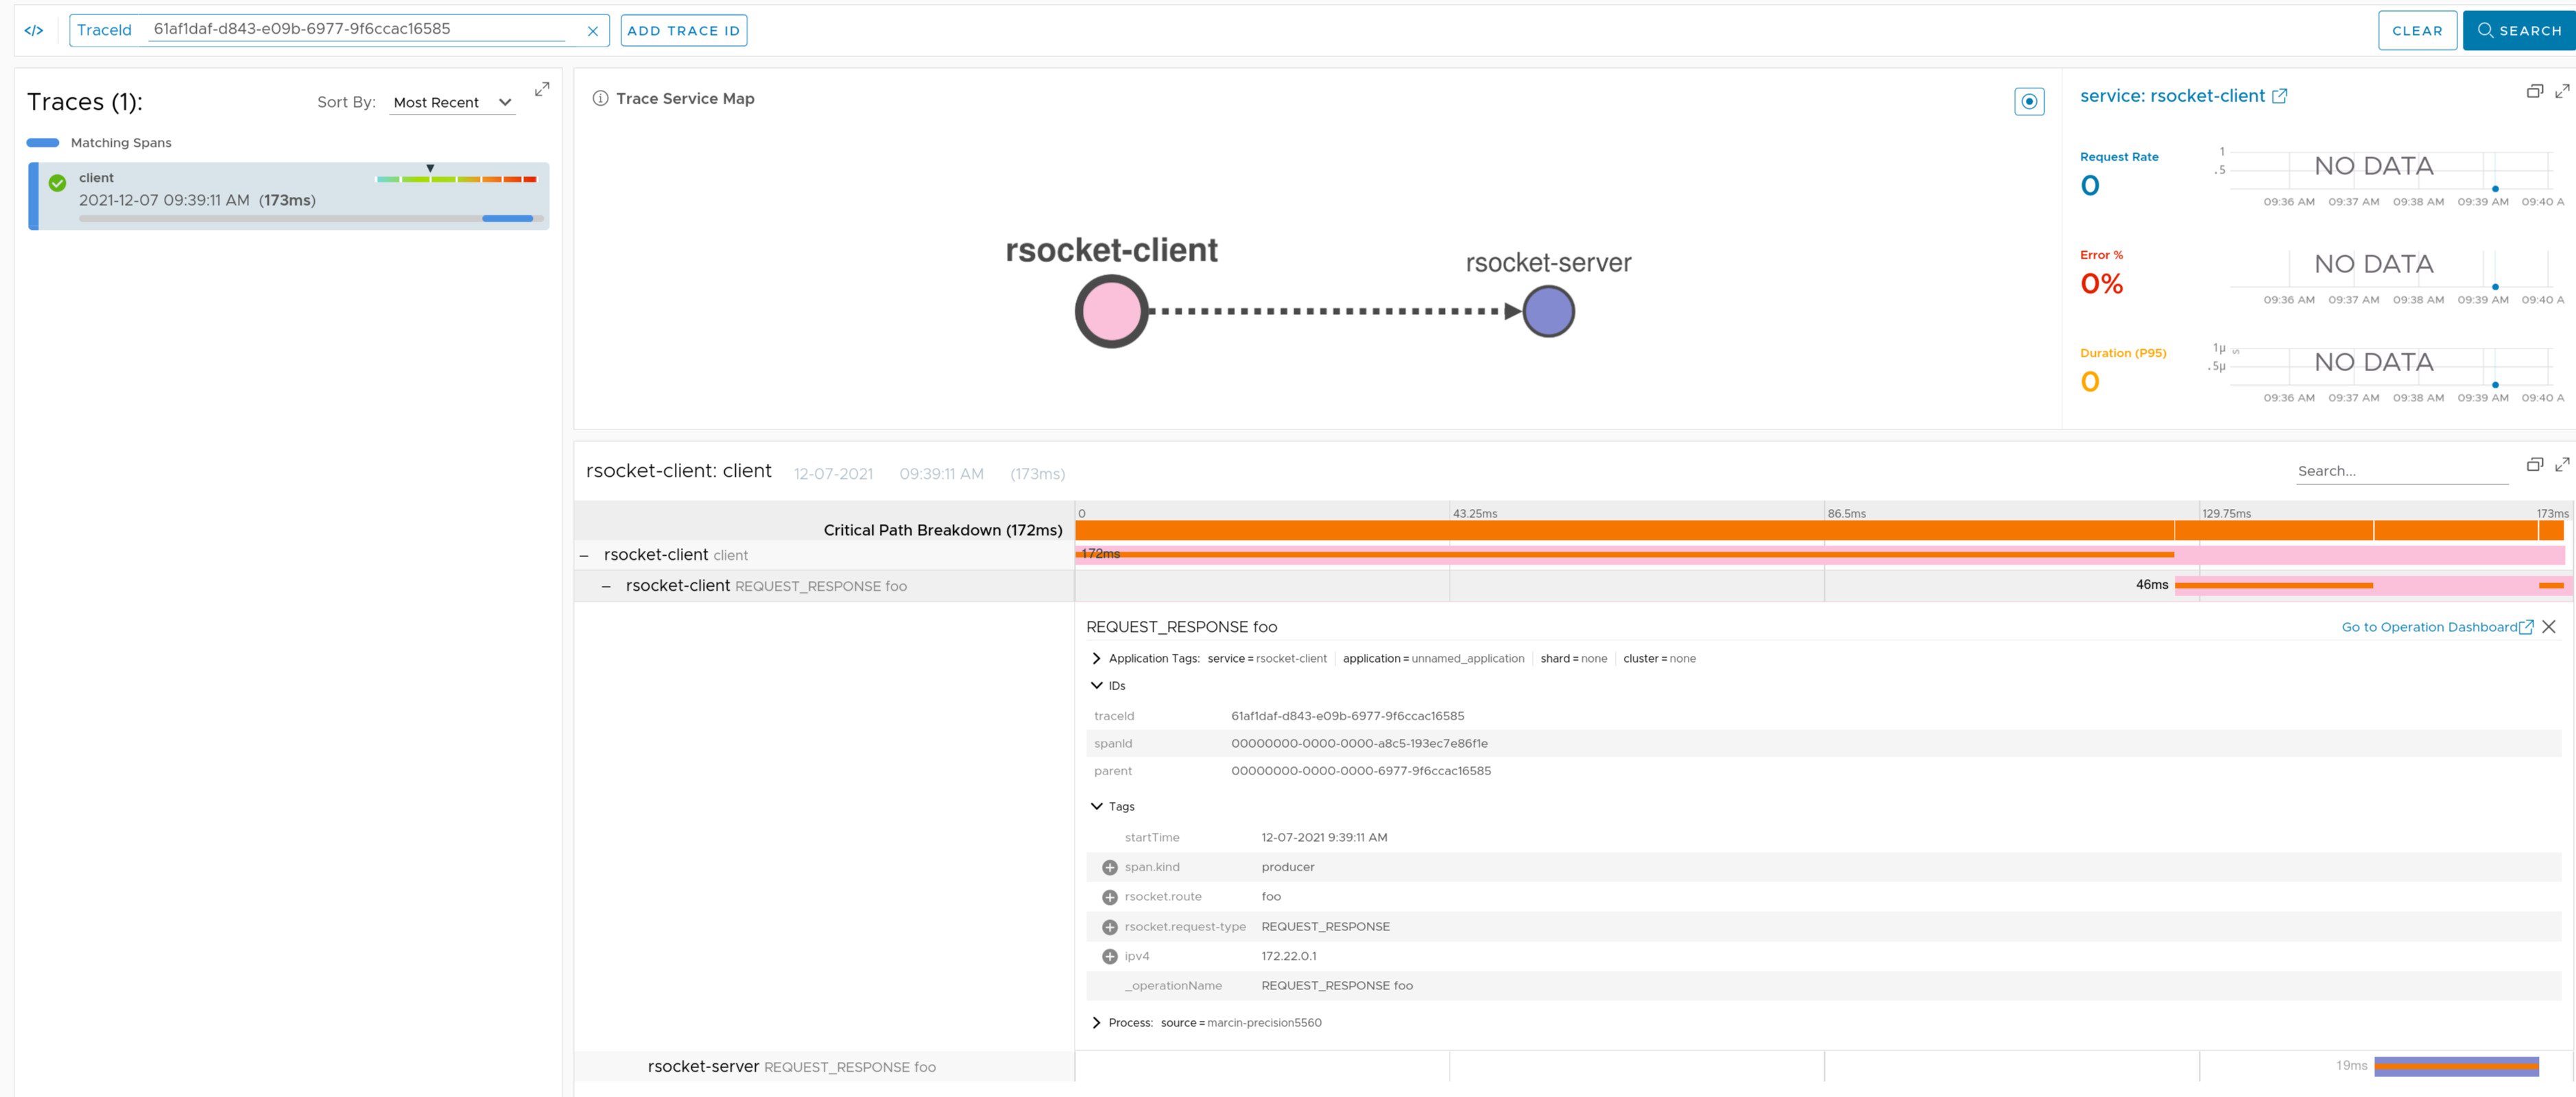
Check the docs for more details.
Here you can find a sample that depicts this integration for RSocket server.
Here you can find a sample that depicts this integration for RSocket client.
If you have Spring Cloud Task running on the classpath, we're instrumenting TaskExecutionListener and CommandLineRunner and ApplicationRunner.
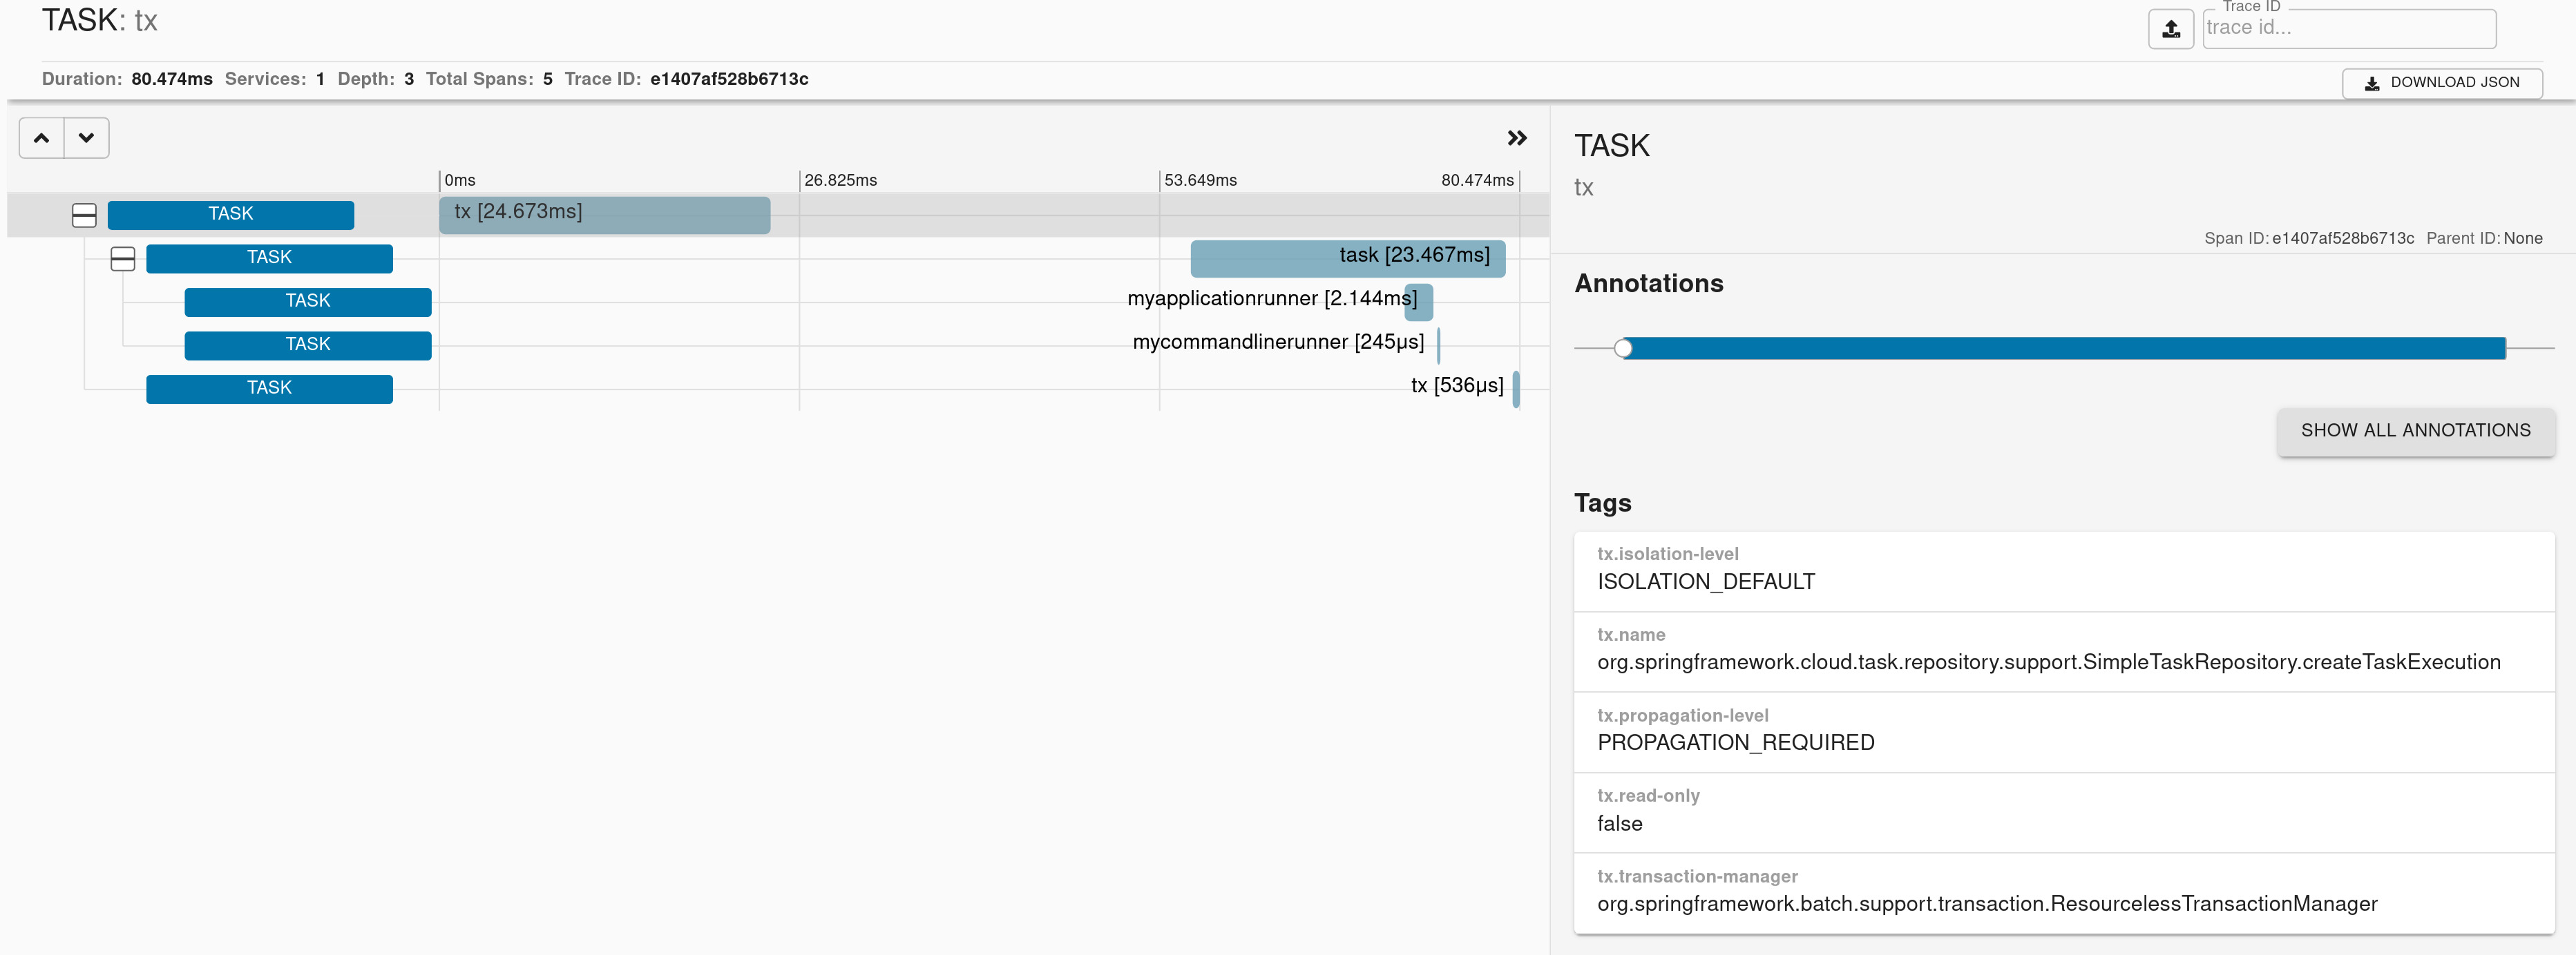
Here you can find a sample that depicts this integration.
If you have Spring Cloud Config Server running on the classpath, we will wrap the EnvironmentRepository in a span.
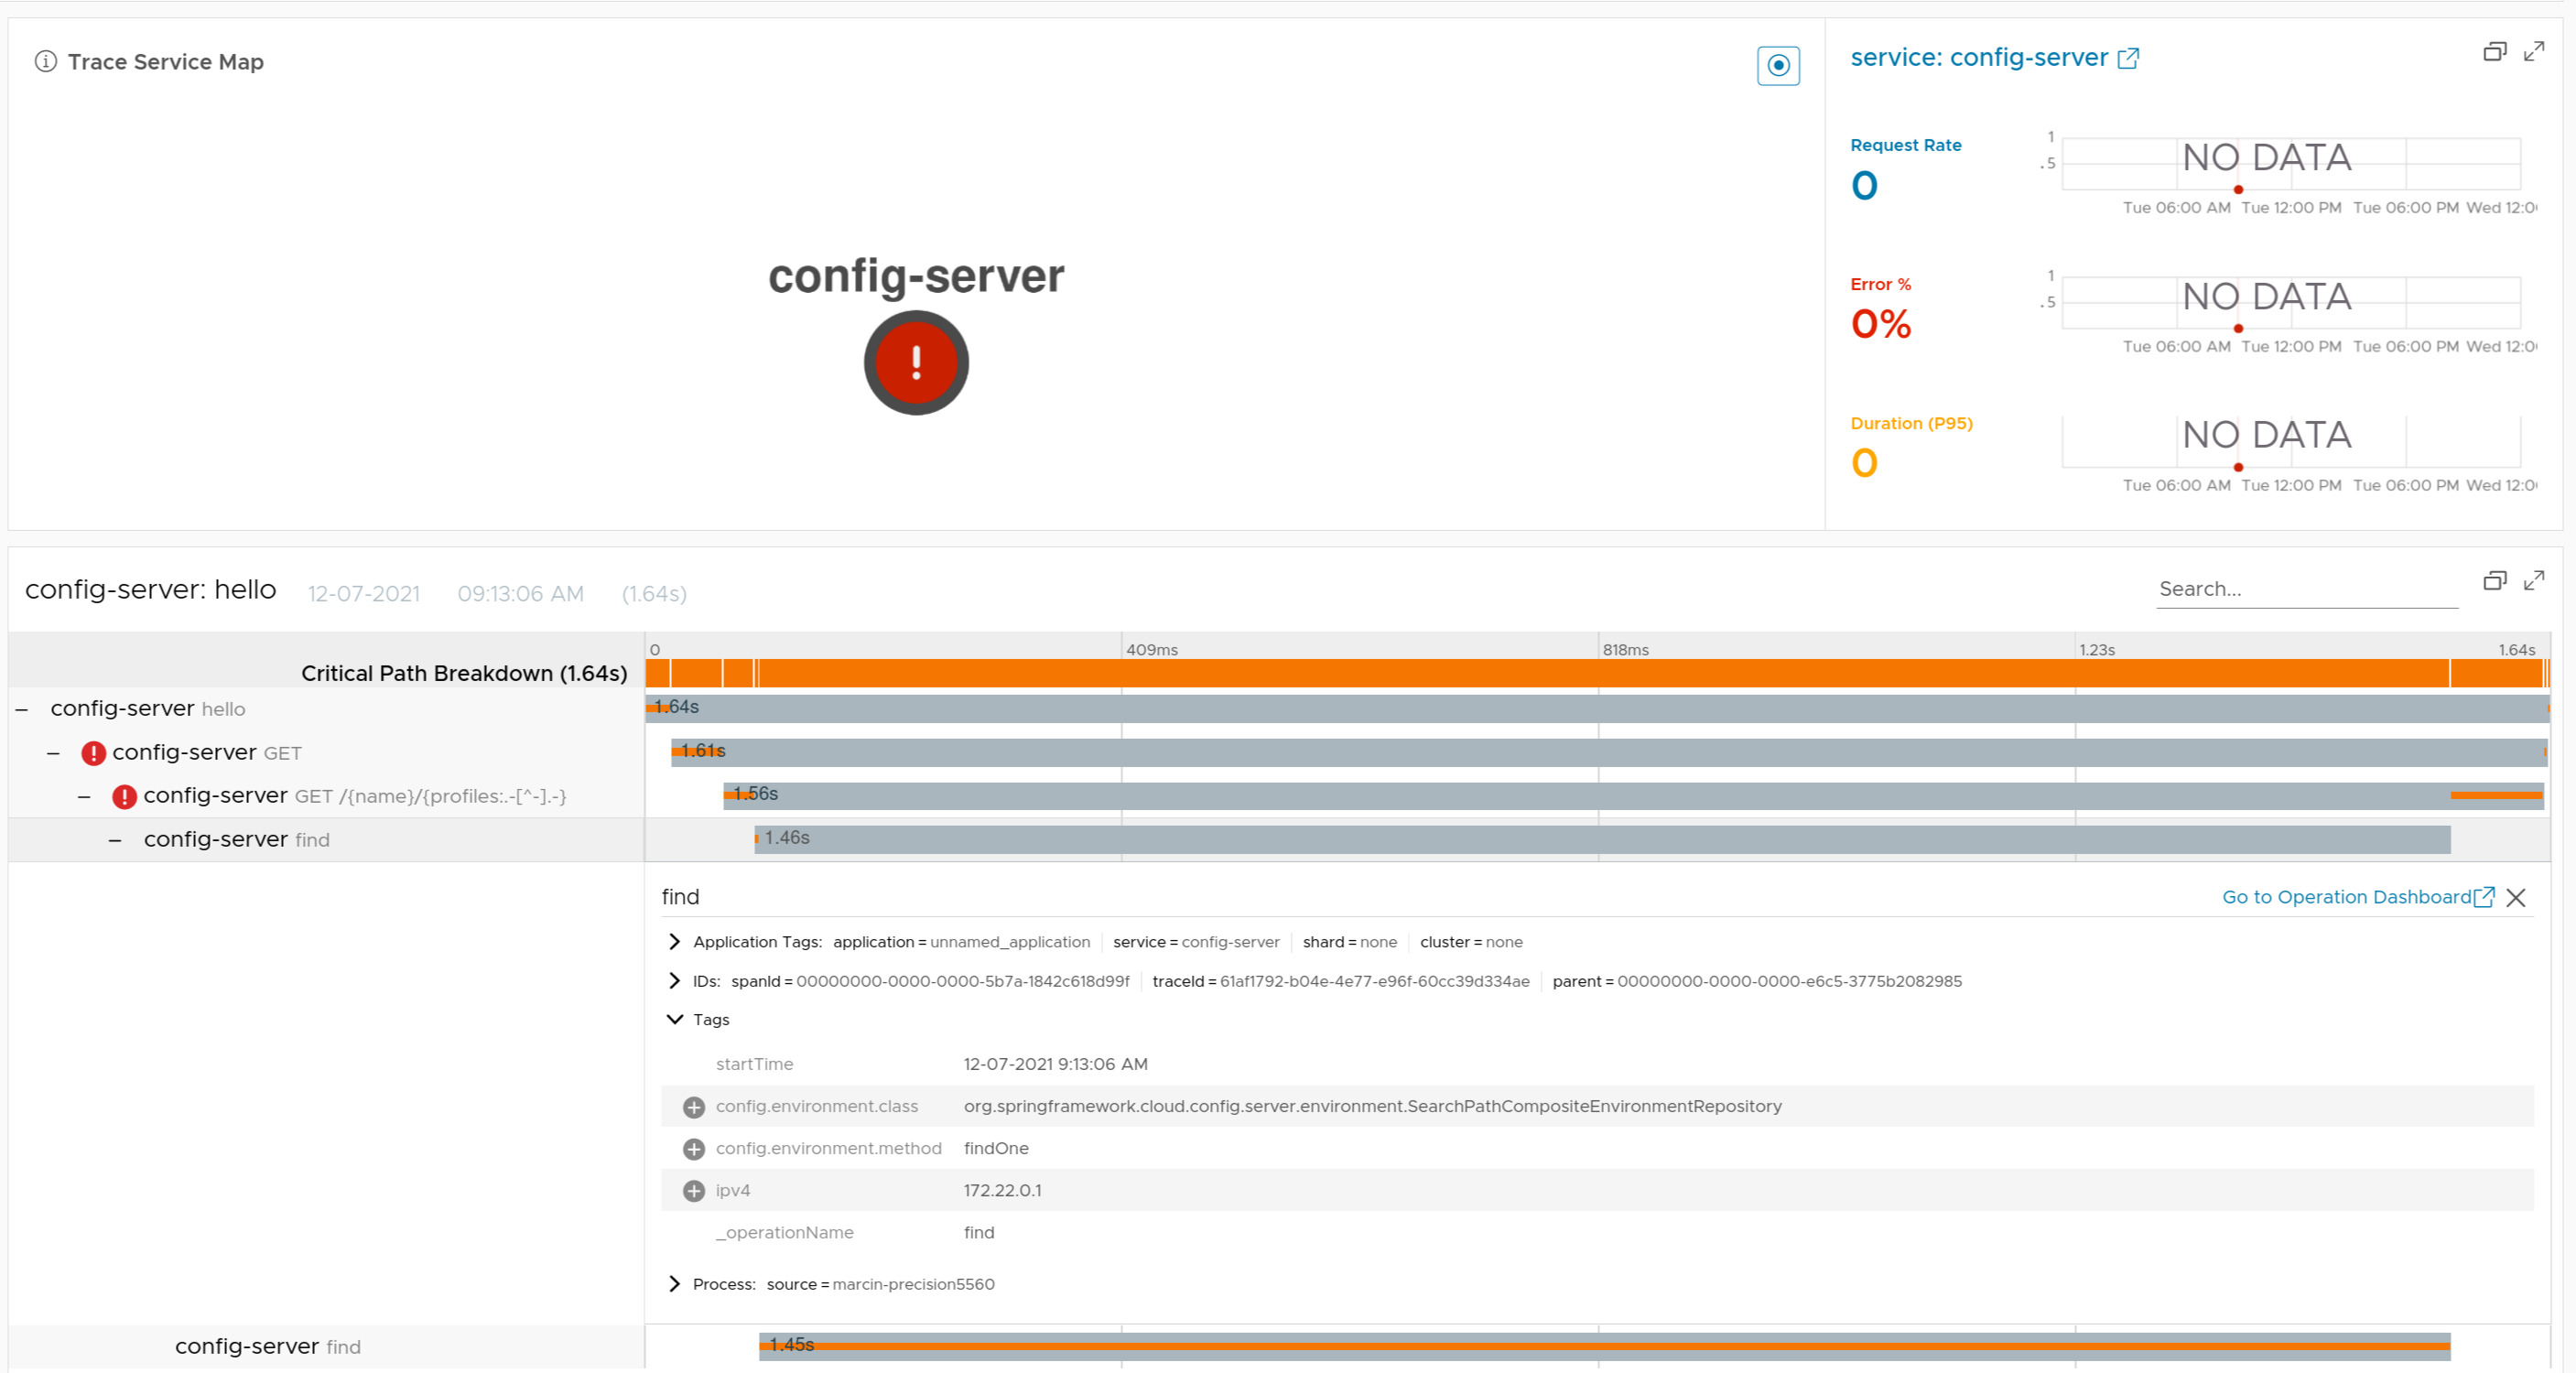
Check the docs for more details.
Here you can find a sample that depicts this integration.
If you have Spring Cloud CircuitBreaker on the classpath, we will wrap the passed command Supplier and the fallback Function in its trace representations.
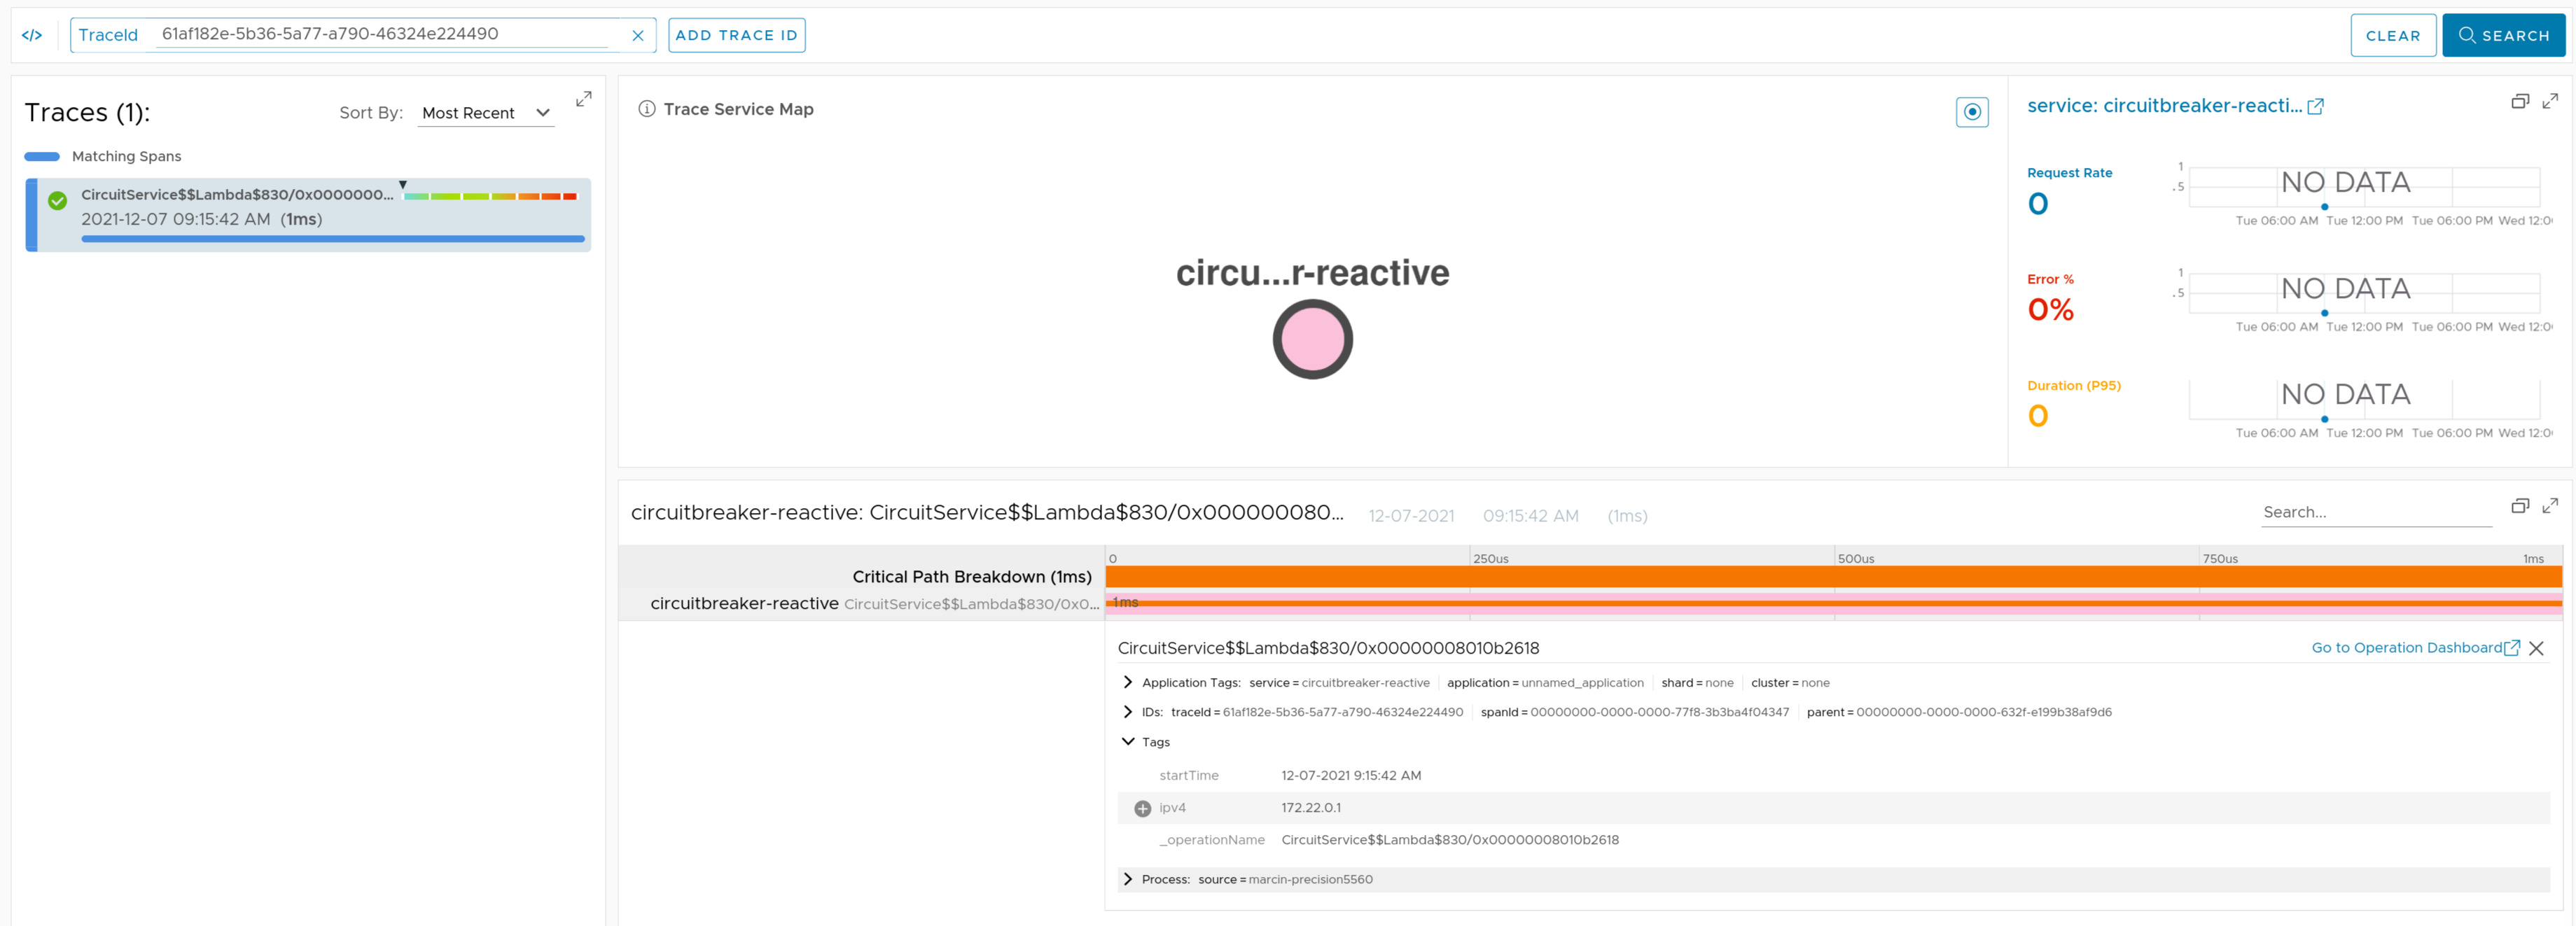
Check the docs for more details.
Here you can find a sample that depicts this integration.
If you have Spring Data Cassandra on the classpath, we’re instrumenting Casandra’s CqlSession and ReactiveSession interfaces and we’re providing our own implementation of the RequestTracker.
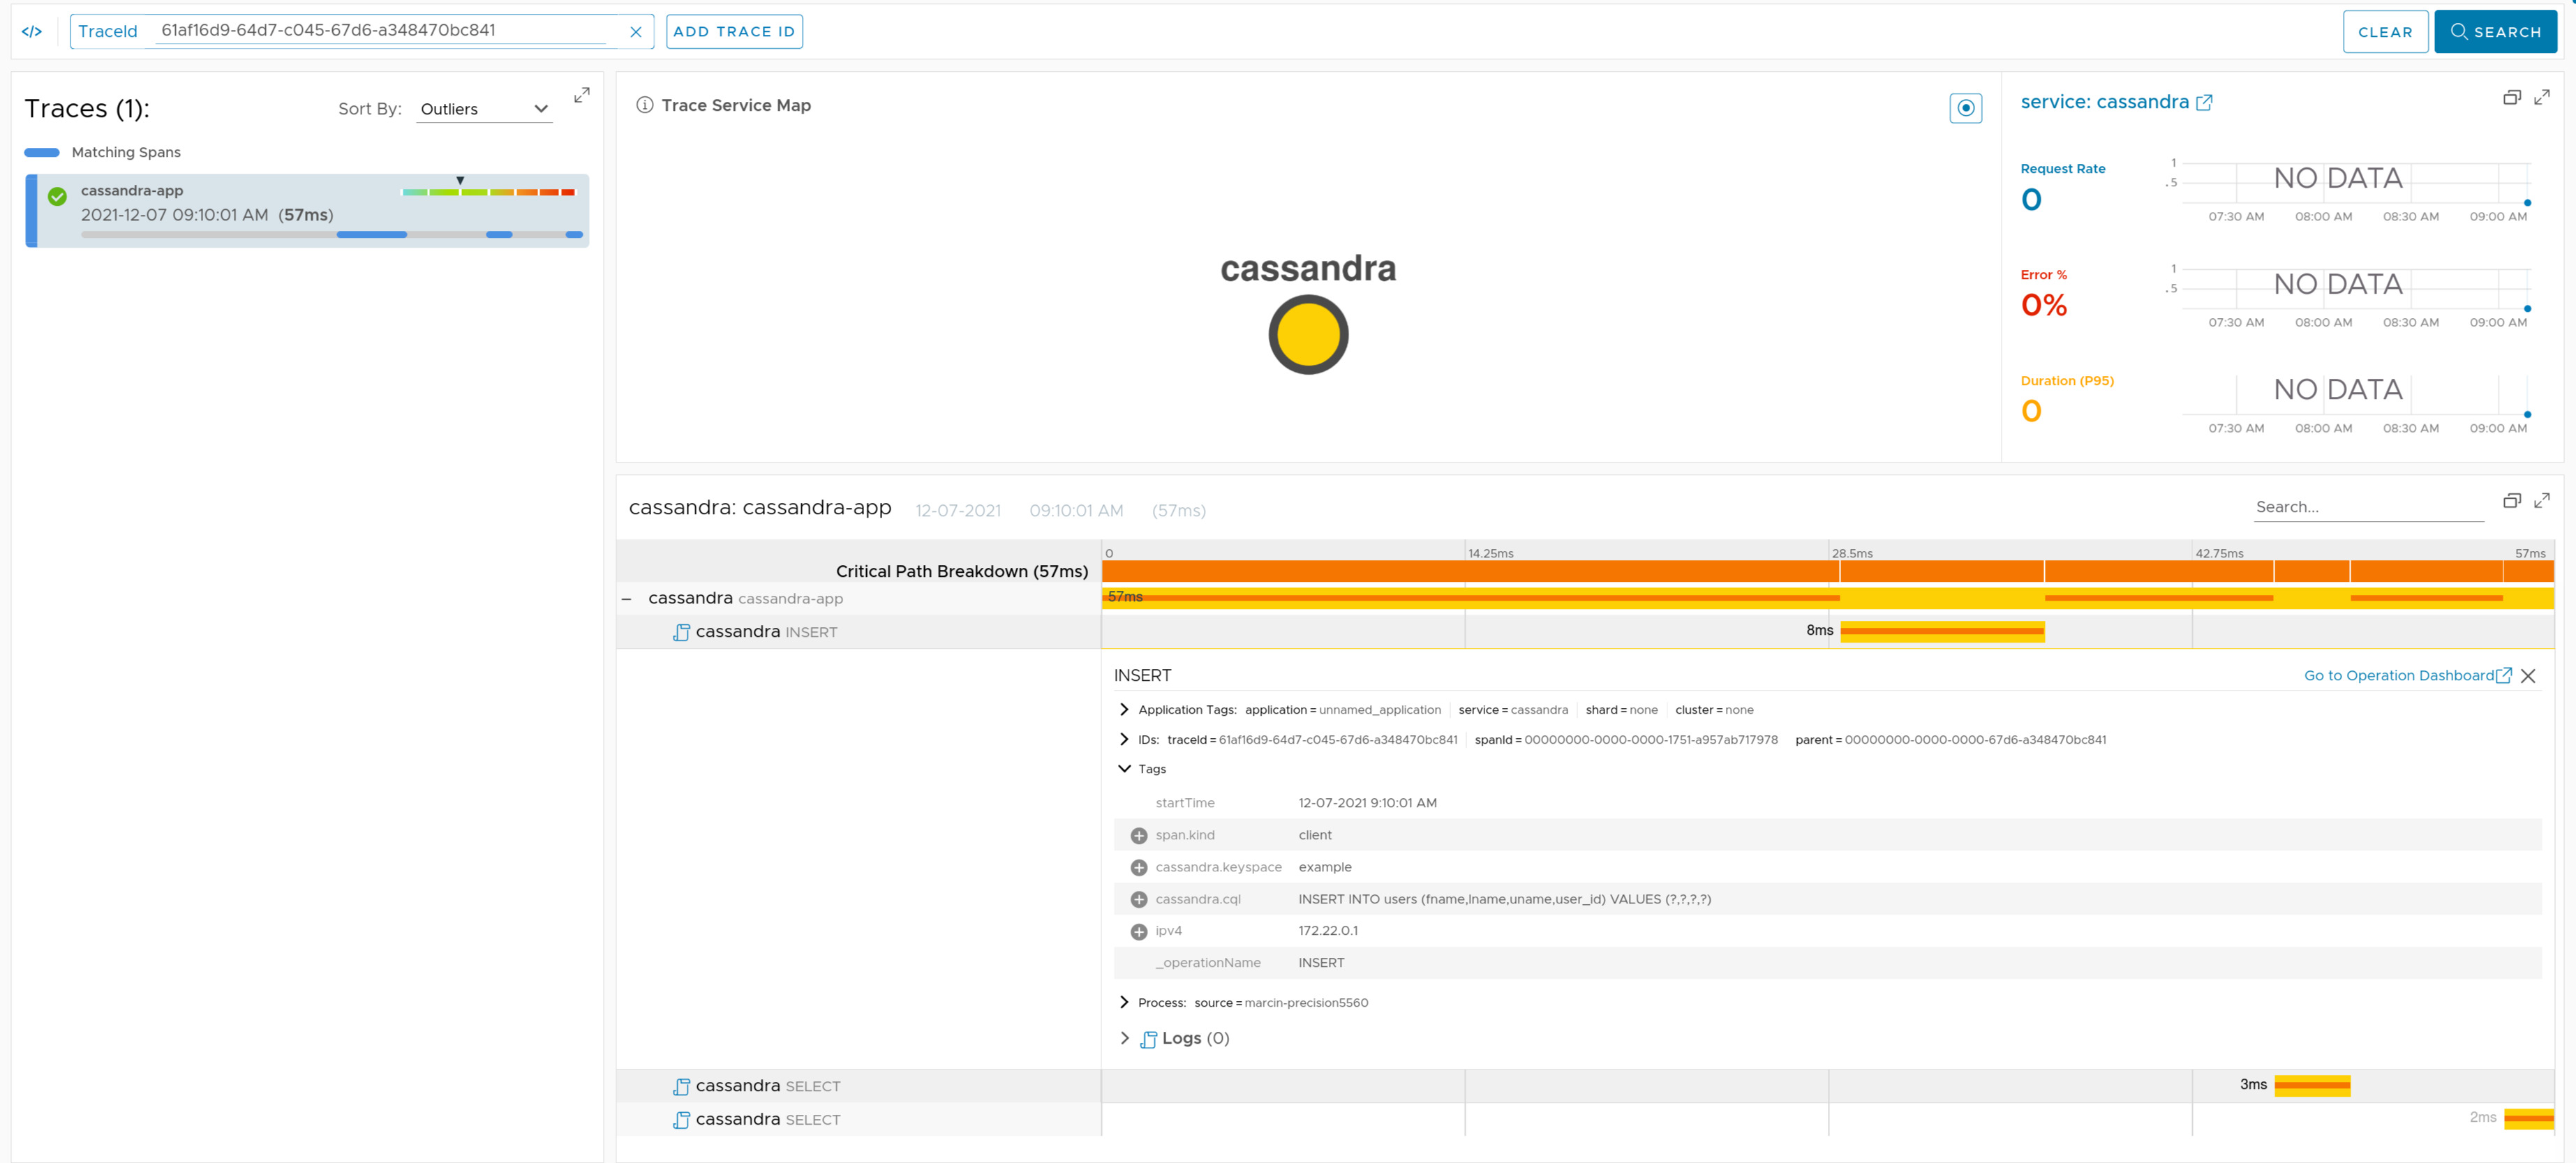
Check the docs for more details.
Here you can find a sample that depicts this integration for non reactive Cassandra.
Here you can find a sample that depicts this integration for reactive Cassandra.
If you have Spring Session on the classpath, we’re instrumenting the Session repositories that wraps all operations in a span.
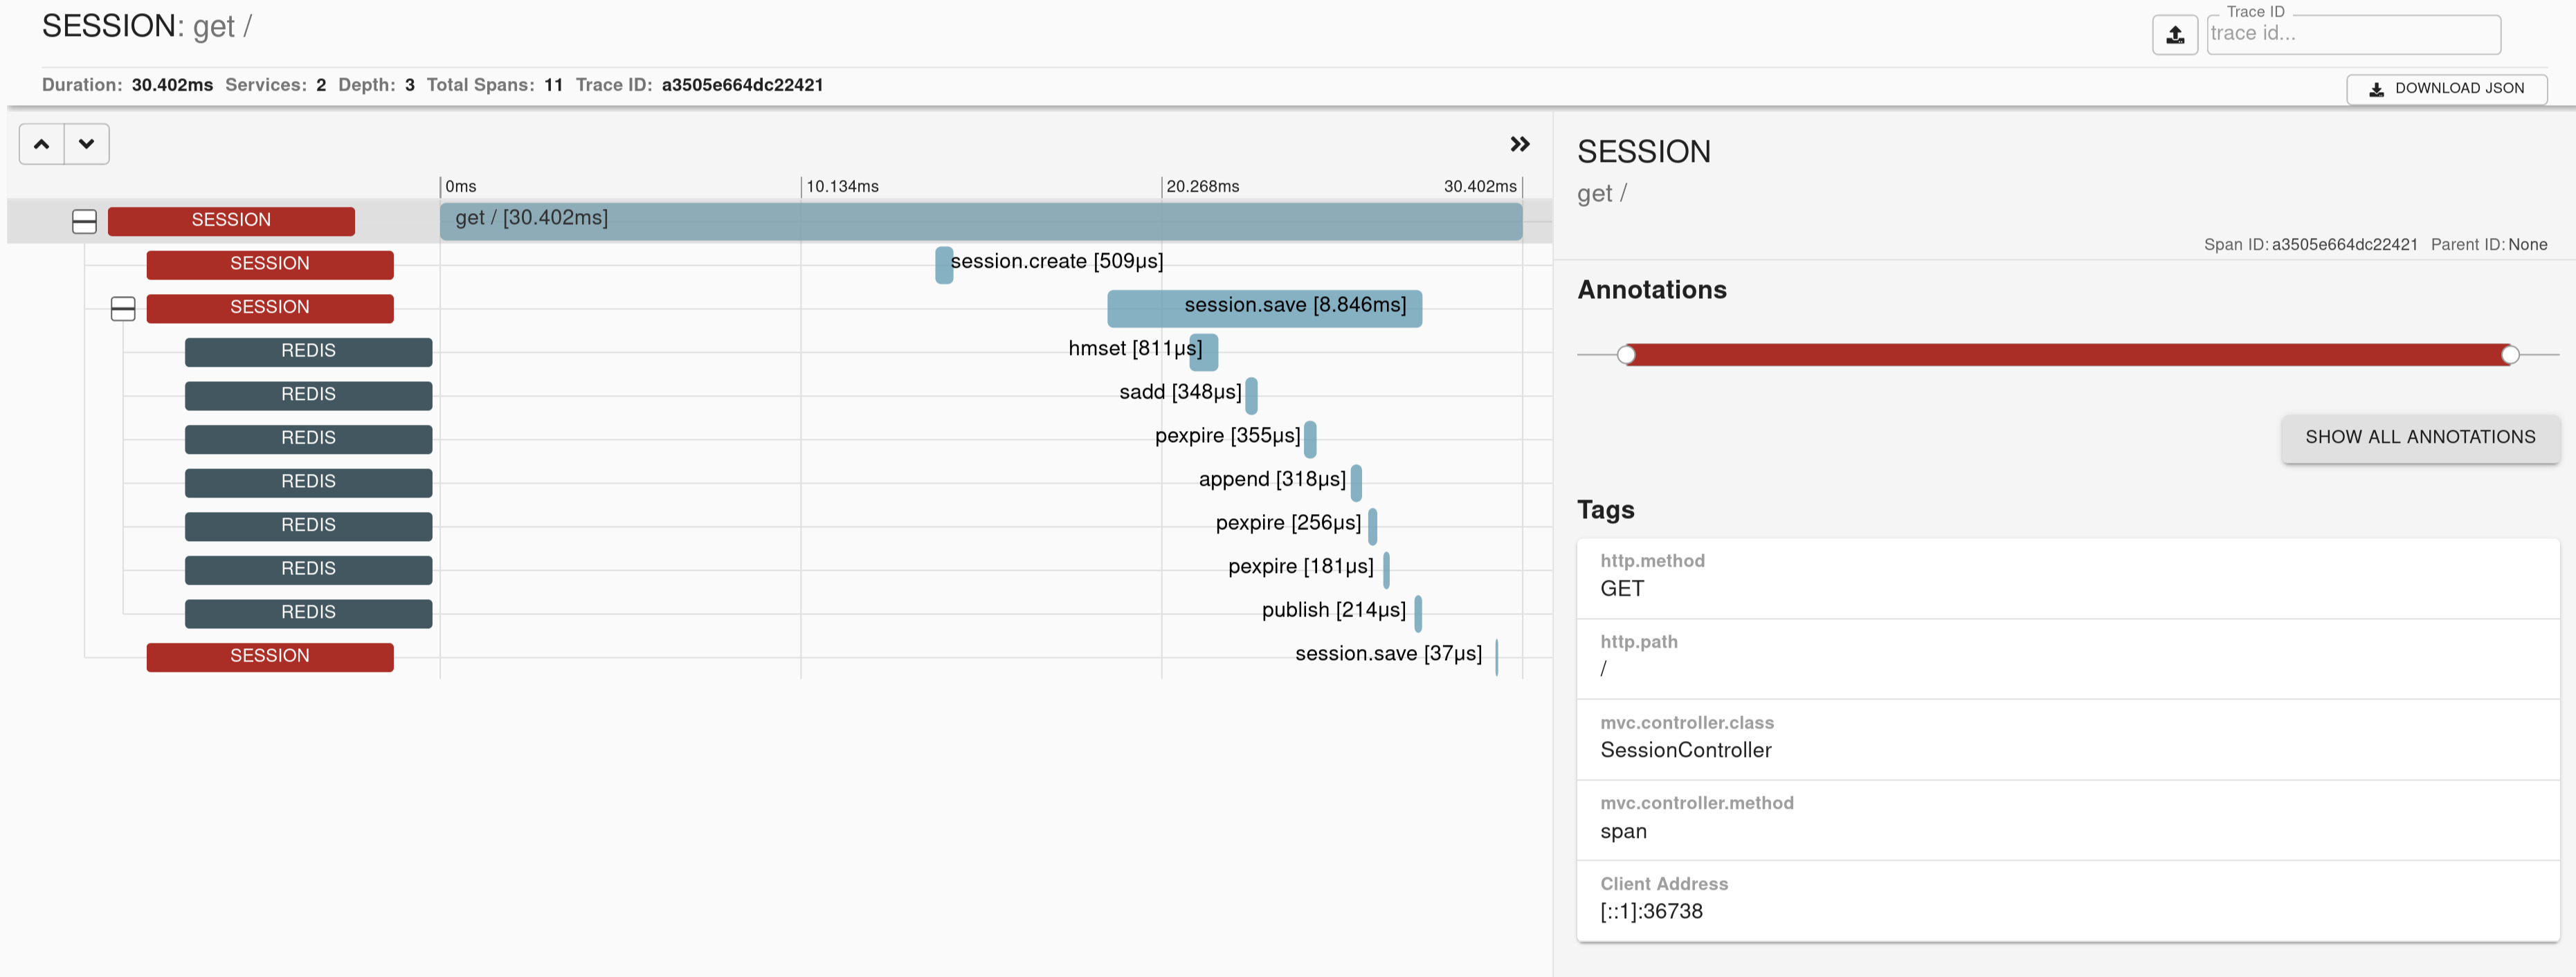
Check the docs for more details.
Here you can find a sample that depicts this integration.
If you have Spring Security on the classpath, we create an implementation of SecurityContextChangedListener that annotates a current span with an event when context has changed.
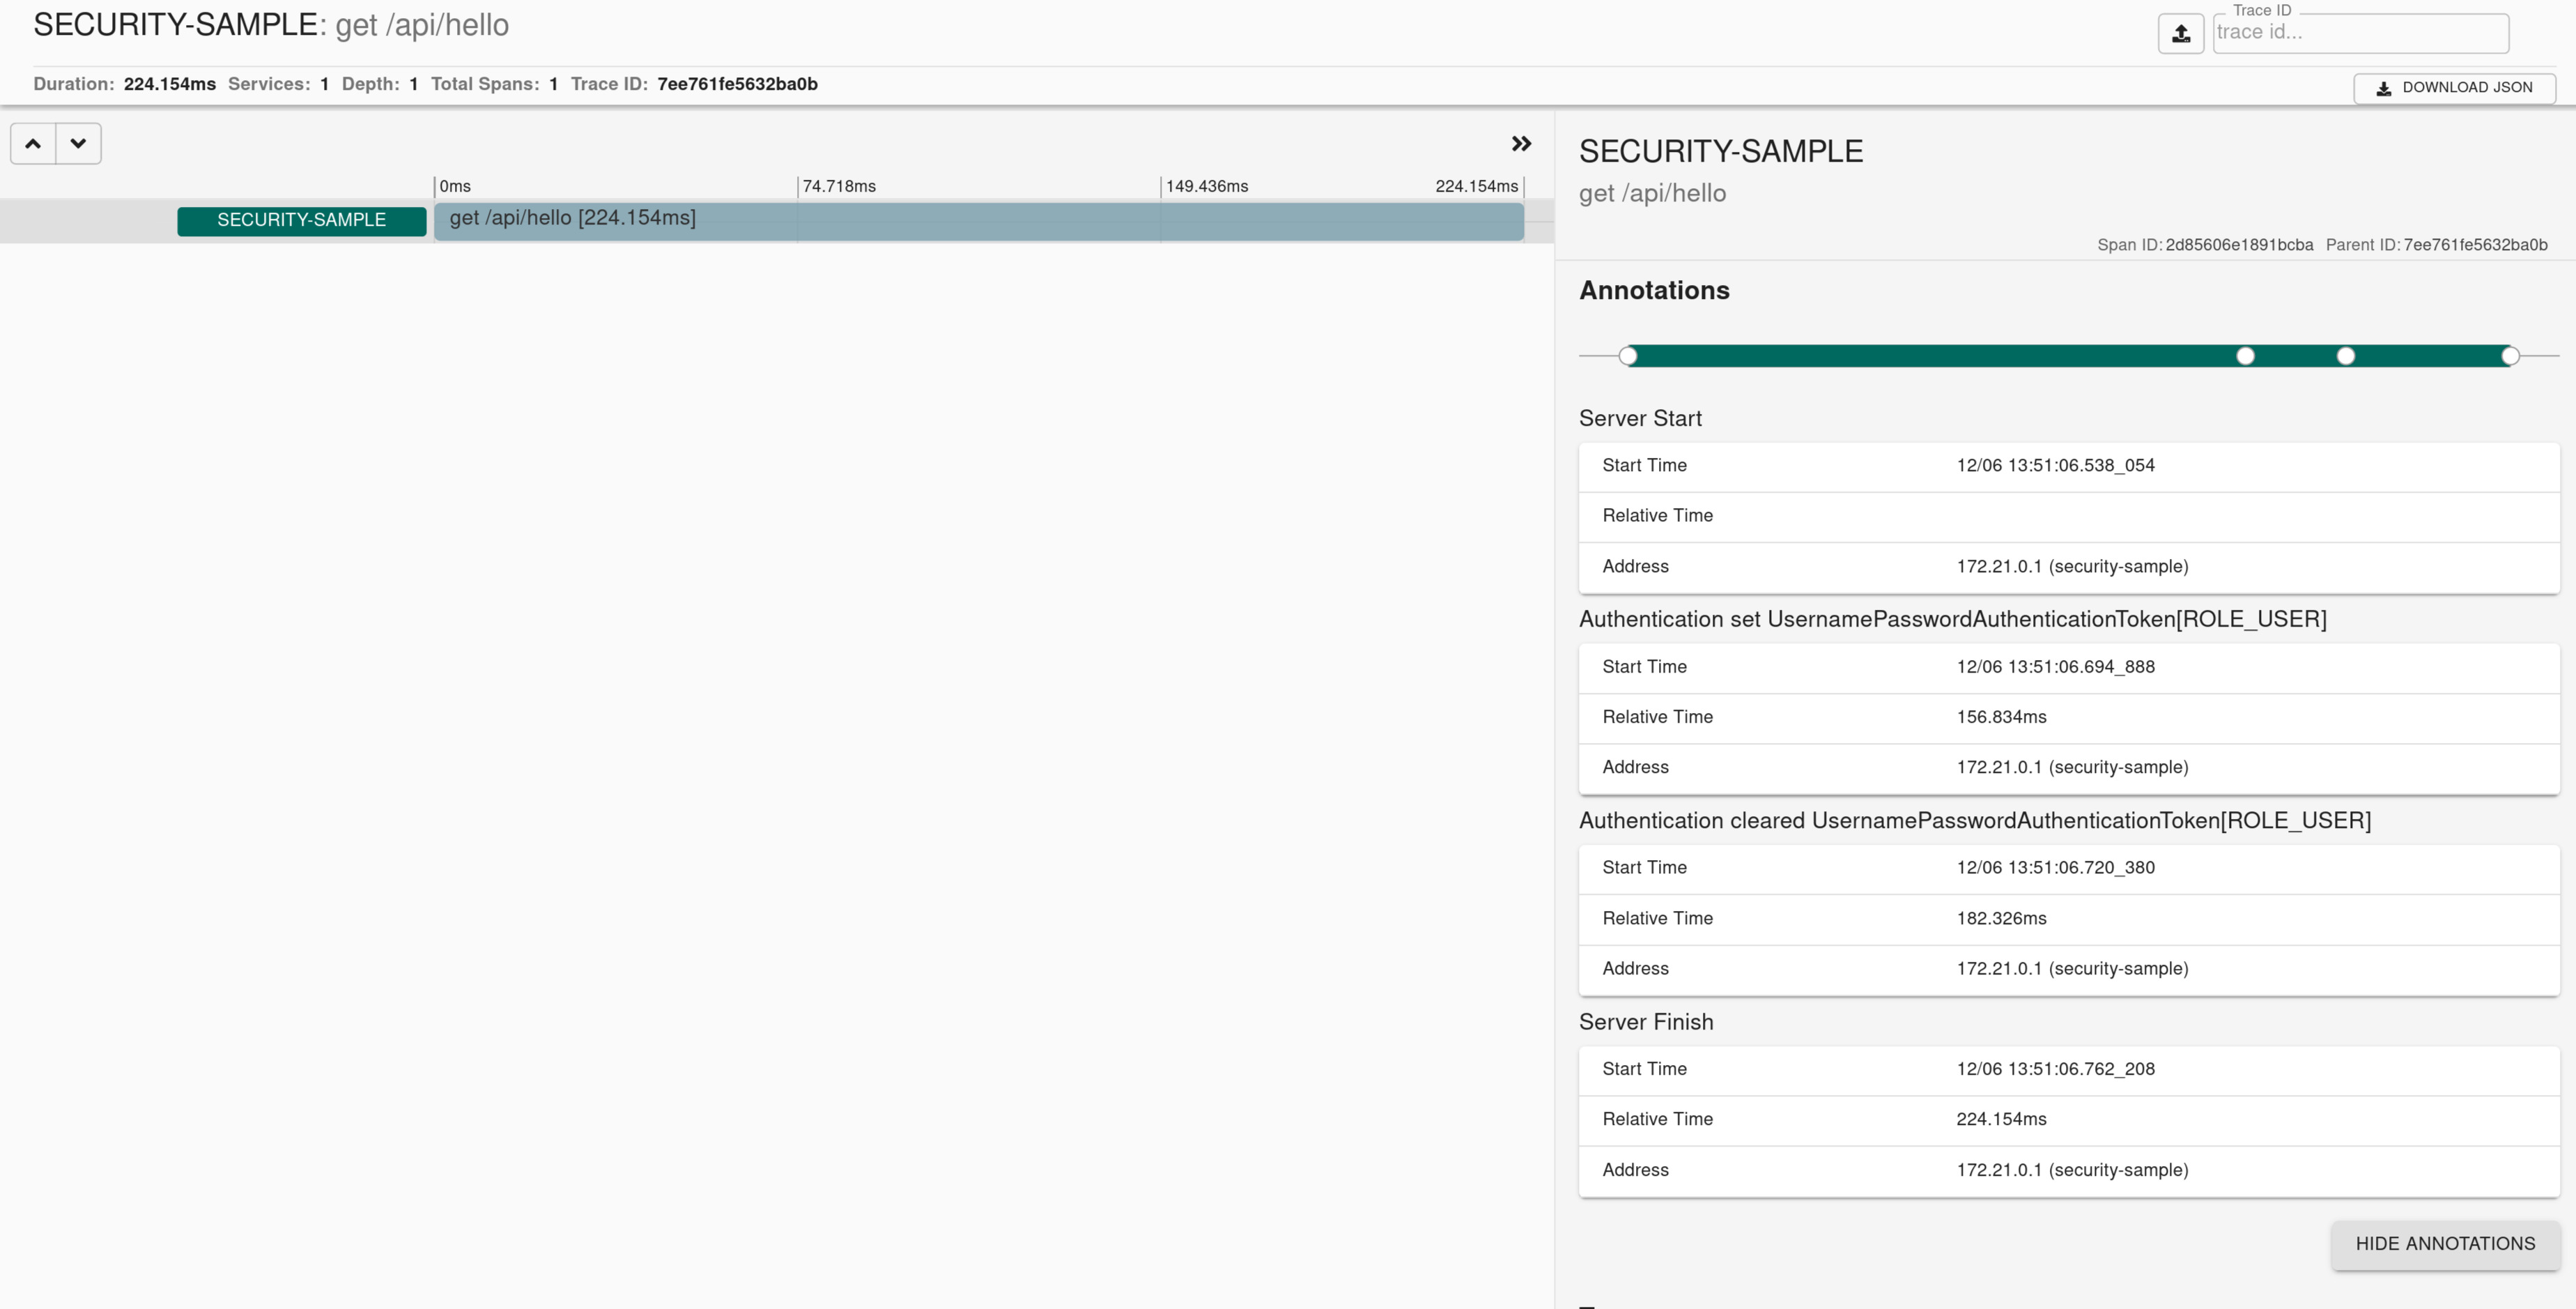
Here you can find a sample that depicts this integration.
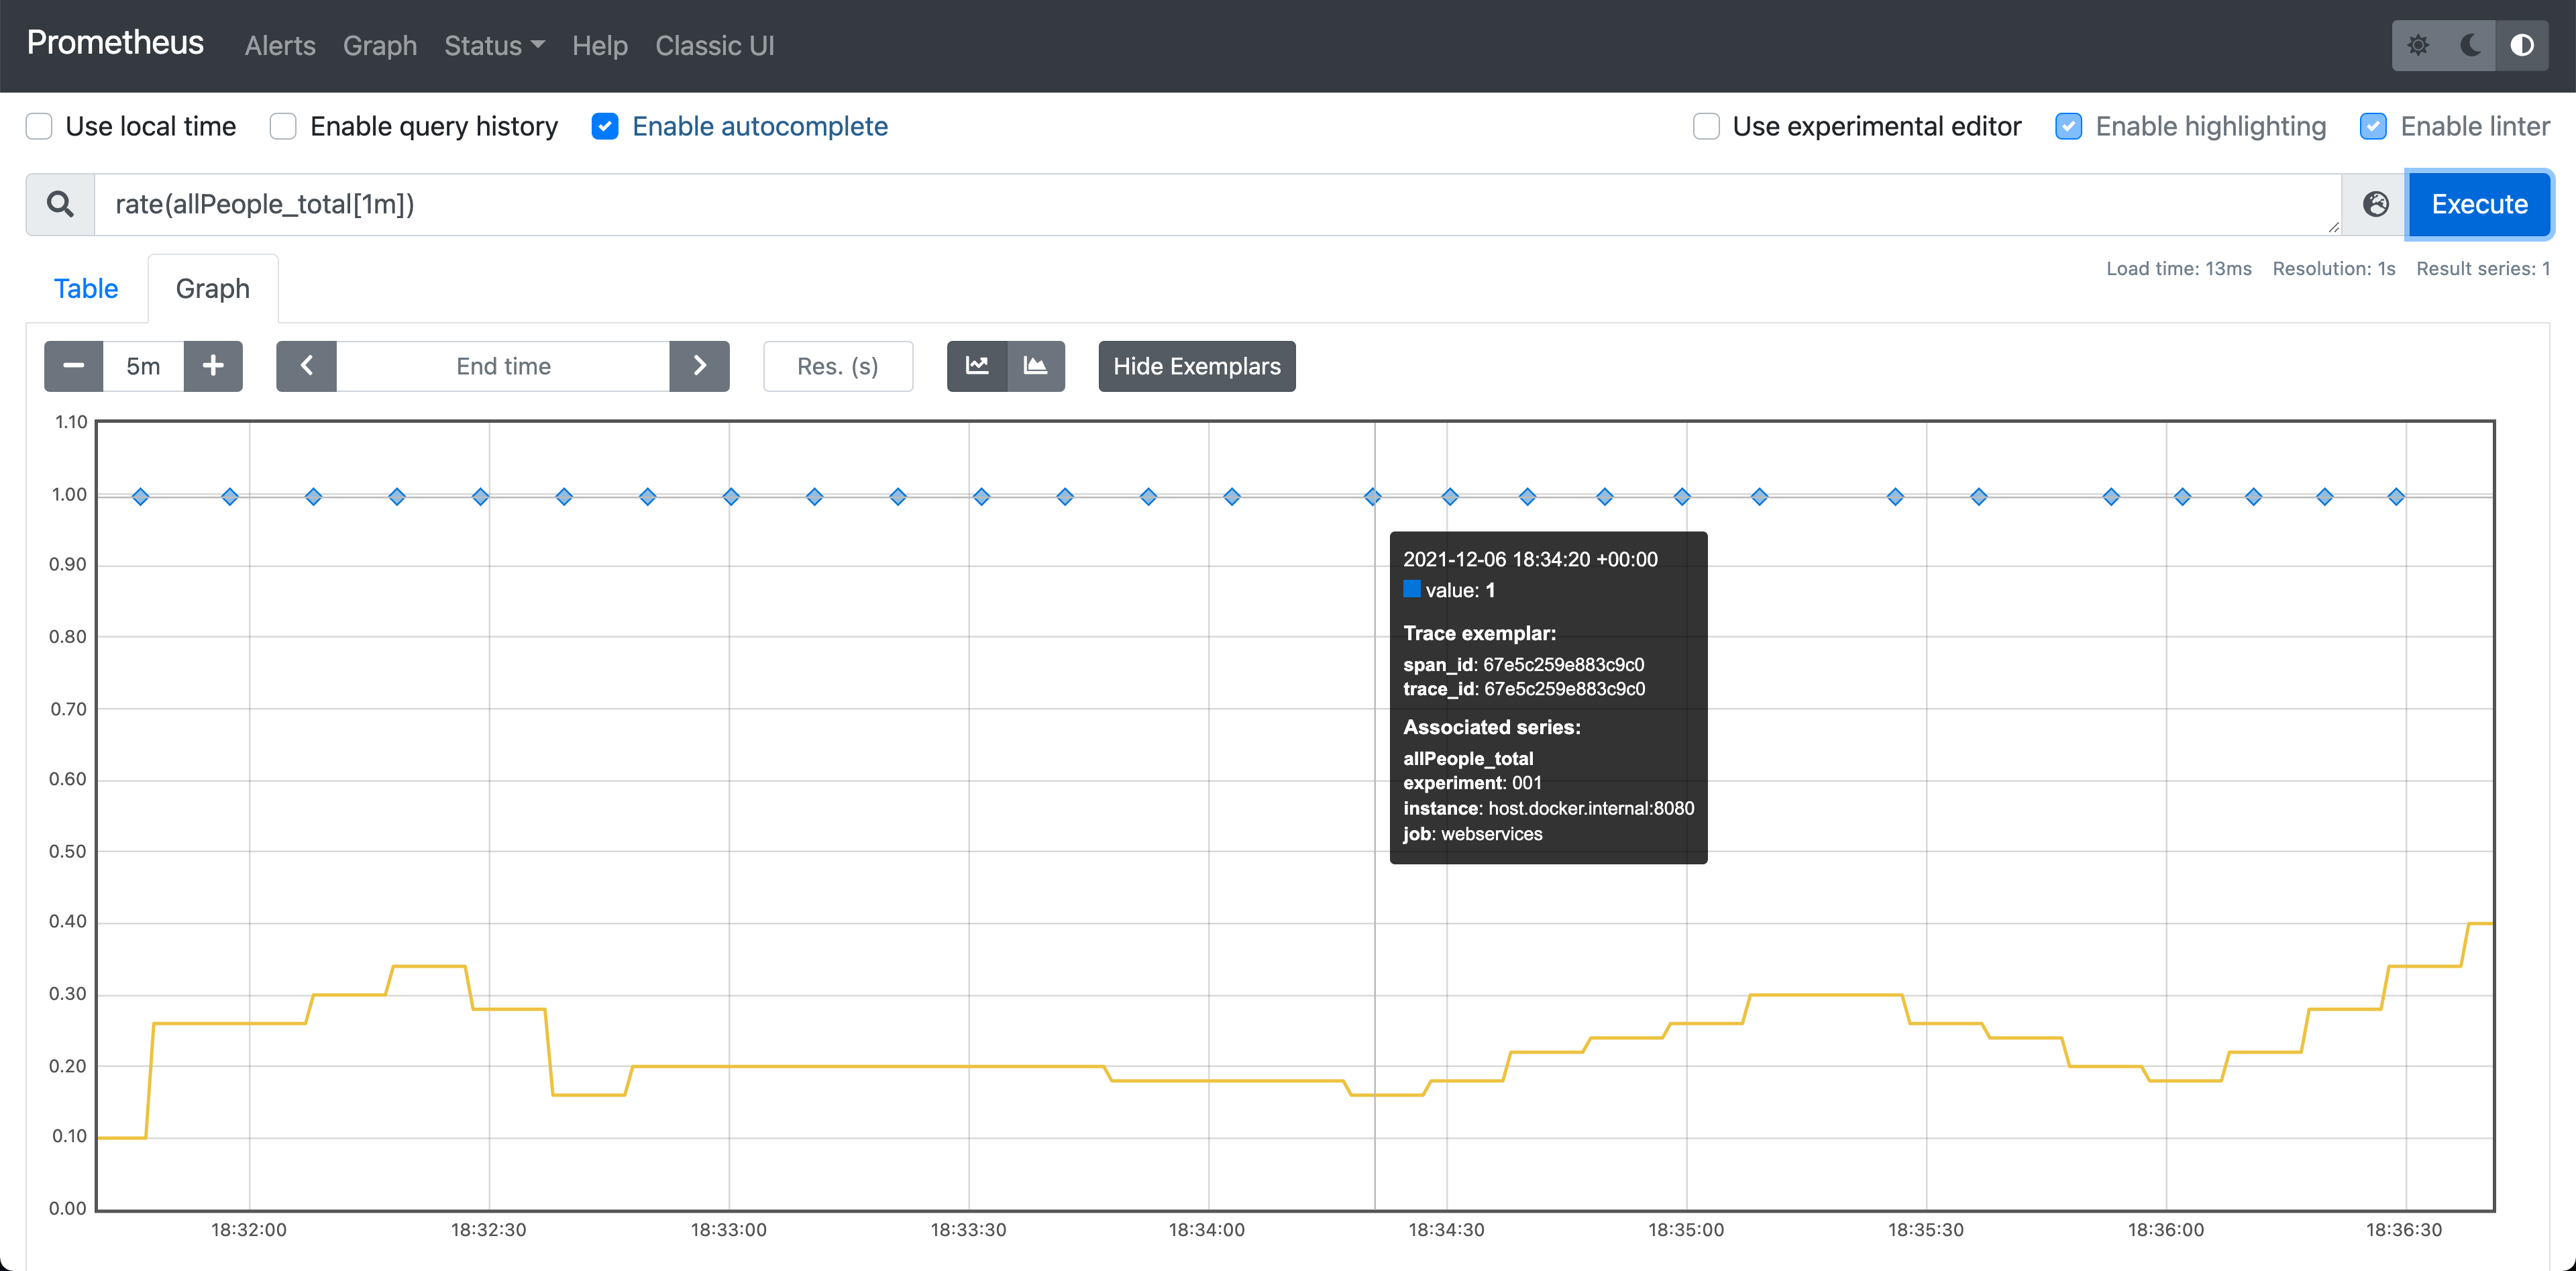
Exemplars are metadata attached to metrics (see: Prometheus Exemplars), e.g.: traceId so that you can get an example traceId for your metrics.
We're integrating Sleuth with Prometheus so that if somebody uses the Prometheus Java Client, they can get Exemplars using Sleuth. This issue is also connected to the Micrometer Exemplars Support, see.
Here you can read more about the issue.
There are a couple of notes to take into consideration with regards to this feature:

Spring Cloud Sleuth can instrument Spring Cloud Function. Since Spring Cloud Stream uses Spring Cloud Function you will get the messaging instrumentation out of the box.
The way to achieve it is to provide a Function or Consumer or Supplier that takes in a Message as a parameter e.g. Function<Message<String>, Message<Integer>>.
If the type is not Message then instrumentation will not take place.
For a reactive Consumer<Flux<Message<?>>> remember to manually close the span and clear the context before you call .subscribe().
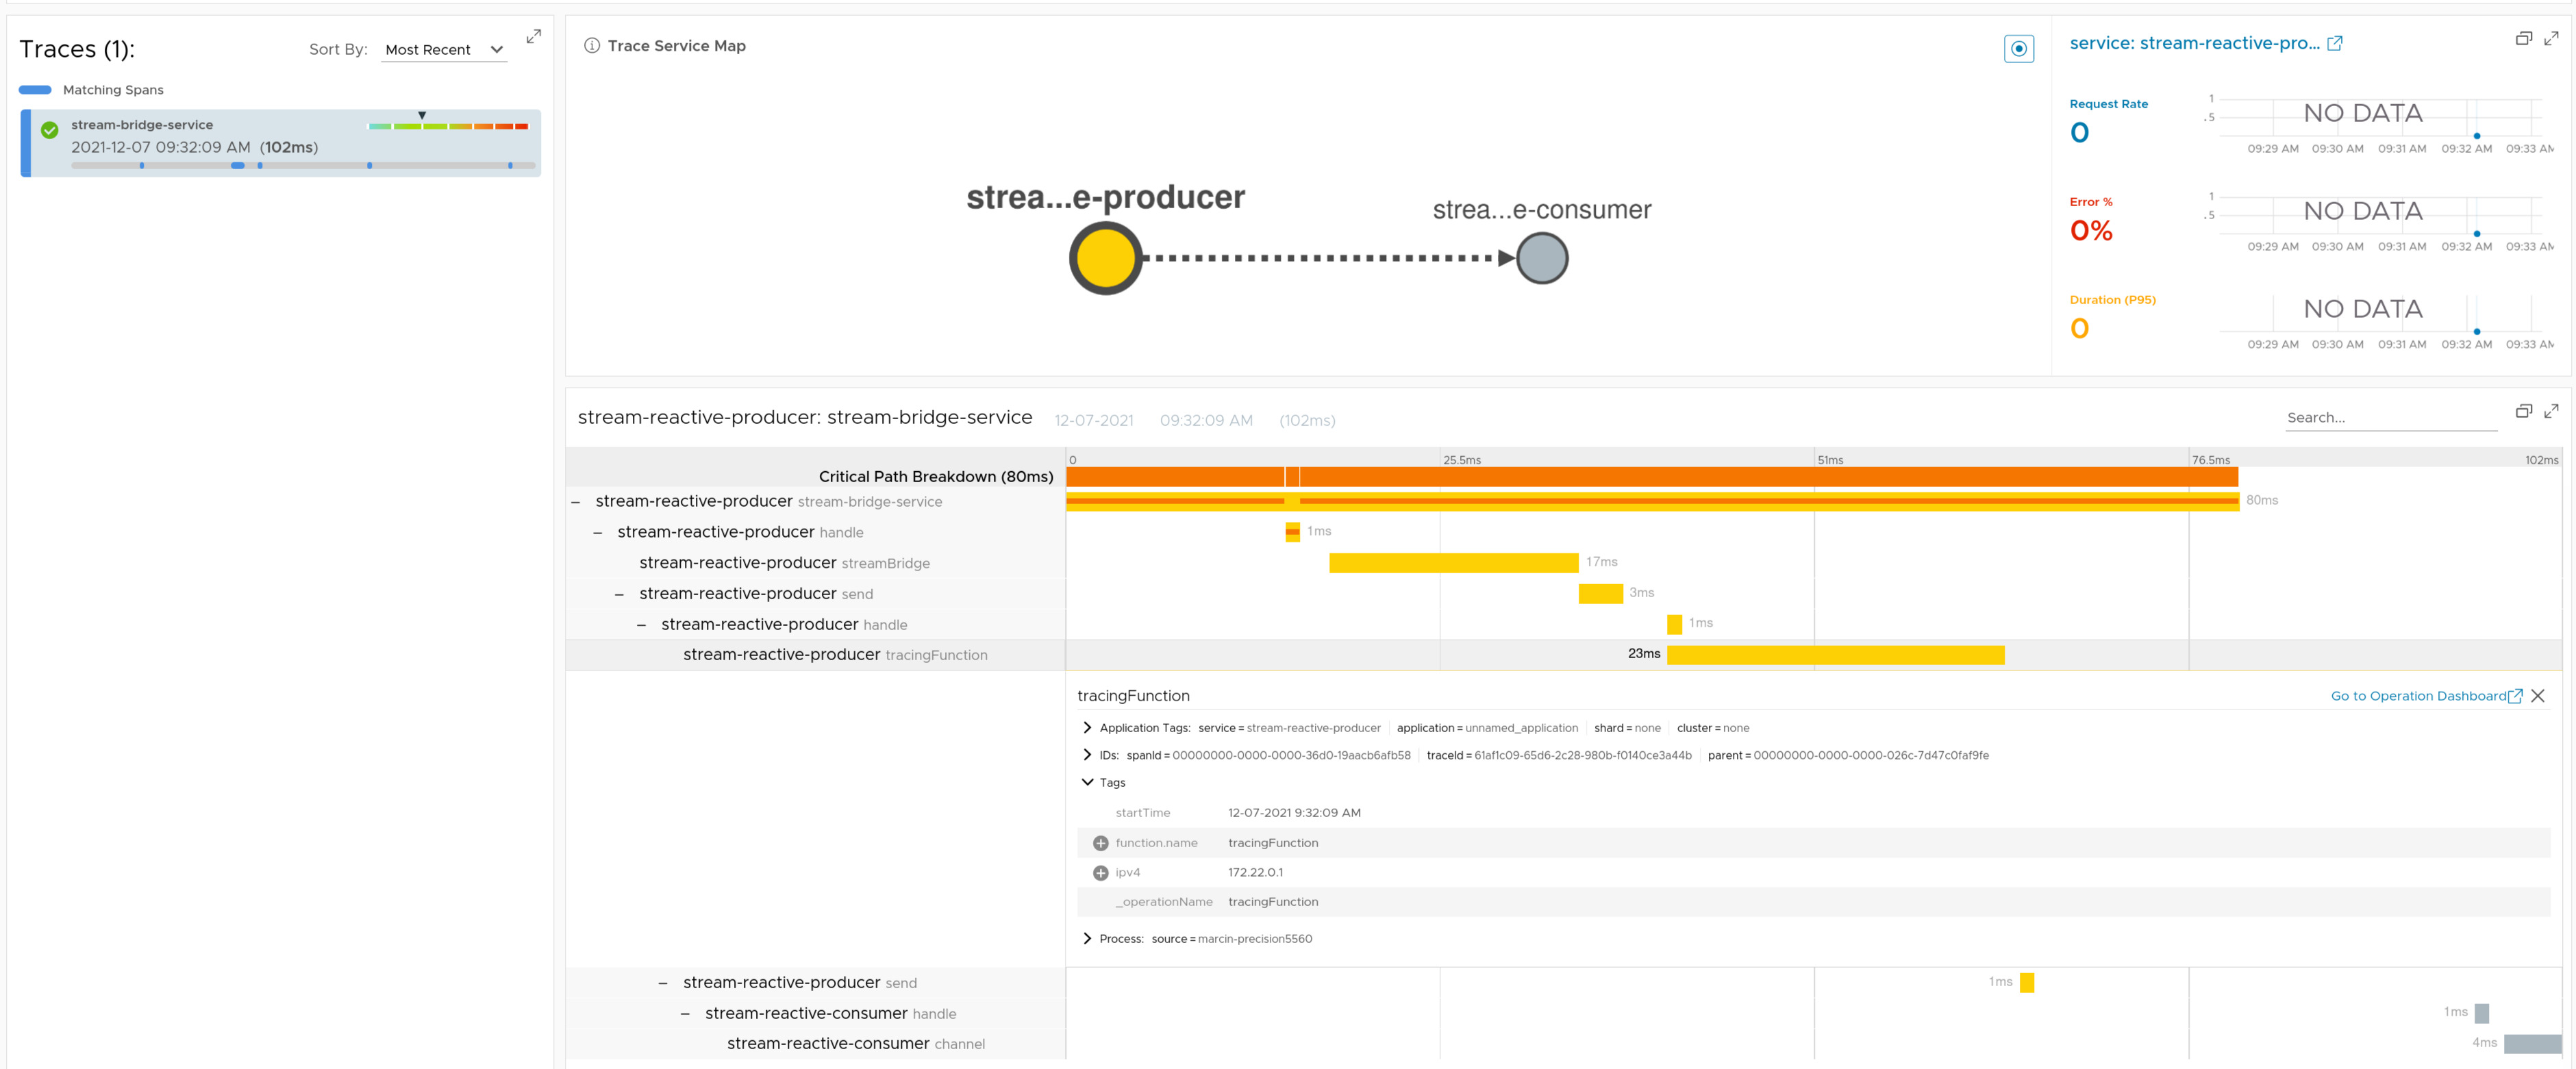
Here you can find a sample that depicts this integration for the producer.
Here you can find a sample that depicts this integration for the consumer.
We’re adding command listeners that wrap all commands in a span. It works both for the Reactive and non Reactive case.

Here you can find a sample that depicts this integration.
With this PR the Redis instrumentation can work for other Tracers, such as OpenTelemetry.
Spring Cloud Sleuth comes with a traces Actuator endpoint that can store finished spans. The endpoint can be queried either via an HTTP Get method to simply retrieve the list of stored spans or via HTTP Post method to retrieve the list and clear it.
Check the docs for more details.
This release introduces a lot of instrumentations. We would love to see your traces! You can go to our Gitter and paste a screenshot of your traces so that we can analyze how we can improve it.
In case of any questions don't hesitate to ping us

VMware offers training and certification to turbo-charge your progress.
Learn moreTanzu Spring offers support and binaries for OpenJDK™, Spring, and Apache Tomcat® in one simple subscription.
Learn moreCheck out all the upcoming events in the Spring community.
View all