Get ahead
VMware offers training and certification to turbo-charge your progress.
Learn moreNowadays, applications are built as a collection of small independent upstream services. This accelerates development and allows modules to be focused on specific responsibilities, increasing their quality. This is one of the main advantages of using a microservice approach. However, jumping from one service to another can add extra latency, and this latency can be dramatically higher when the services are not responding.
If you run microservices, you want to prevent your upstream services from being called when they are not working properly. Even using a circuit breaker pattern can also generate a penalty in the response time. For this reason, it is sometimes better to actively check your upstream services to verify they are ready before they are needed.
A health check is a way to determine if a service can respond correctly according to its status, preventing timeouts and errors.
Passive health check is done during request handling. If the service is finally unhealthy, the application will return a failure marking the endpoint unhealthy. It can add extra latency.
Active health check will check and drop unhealthy services in the background before receiving the request. It doesn't add extra latency.
Last but not least, these features can be combined with a circuit breaker library to immediately fall back on an alternative endpoint without suffering the first miss penalty.
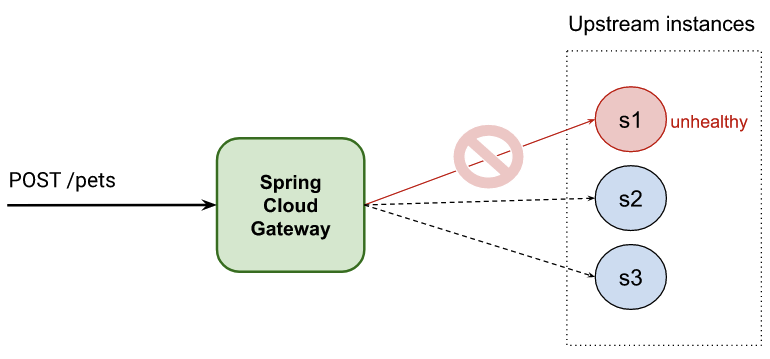
The goal is for routes to forward the requests to upstream services that are healthy by using a load balancer strategy:
This post is divided into two parts:
There are some features in Spring that can help you to get active health check
Spring Cloud Gateway Spring Cloud Gateway provides a library for building API gateways on top of Spring and Java. It supports the above features through the LoadBalancerClientFilter/ReactiveLoadBalancerClientFilter global filters. In this post, you can see different ways to use one of those global filters.
First, though, let’s explore some of those features.
A global filter for load balancing is included in Spring Cloud and can be activated by using a special URI notation: lb://your-service-name.
spring:
 cloud:
   gateway:
     routes:
       - id: myRoute
         uri: lb://your-service-name
         predicates:
         - Path=/service/**
The load balancer filter, ReactiveLoadBalancerClientFilter (for reactive applications), will detect the URI and replace it with an available endpoint associated with "your-service-name".
Take into account that you need to register "your-service-name" in the Service Discovery registry. We will see different ways you can do it in the following sections.
By default, traffic is routed to upstream services, even if they are unhealthy.
To prevent picking a bad one, you can enable the health-check configuration provided by the Load Balancer Client from Spring Cloud:
    spring:
      cloud:
        loadbalancer:
          configurations: health-check
All the endpoints will be checked periodically by automatically using the Spring Boot Actuator health endpoint.
You can also customize some options like spring.cloud.loadbalancer.health-check.<your-service-name>.path and spring.cloud.loadbalancer.health-check.interval.
The default health check configuration checks the upstream service endpoints by using the
/actuator/healthendpoint, which requires activating Spring Actuator in your upstream service.
For more options, explore the LoadBalancerClientsProperties and LoadBalancerProperties classes
There is a built-in feature in Spring Cloud Gateway that will deploy all the services available as routes. This post describes the opposite, so we are declaring routes that are load balanced, including active health check.
In the previous section, you specified a load-balanced URI (lb://your-service-name), but now you need to register the endpoints associated with the service name of the URI.
We are visiting some approaches in the following sections.
You can statically activate client load balancing by configuring the spring.cloud.discovery.client.simple.instances property.
It is a map whose key is the service name (used by the lb:// URI) and the value is an array of org.springframework.cloud.client.ServiceInstance objects that point to the upstream services.
Some benefits of static load balancing include:
The problem is that you are statically setting the upstream services in your configuration. If you need to change the list, you need to restart your application.
Example:
spring:
  cloud:
    gateway:
      routes:
        - uri: lb://hello-service # Load Balancer URI handled by ReactiveLoadBalancerClientFilter
          predicates:
            - Path=/hello
    loadbalancer:
      configurations: health-check # Required for enabling SDC with health checks
    discovery:
      client:
        simple: # SimpleDiscoveryClient to configure statically services
          instances:
            hello-service:
              - secure: false
                port: 8090
                host: localhost
                serviceId: hello-service
                instanceId: hello-service-1
              - secure: false
                port: 8091
                host: localhost
                serviceId: hello-service
                instanceId: hello-service-2
# Run server 1
SERVER_PORT=8090 ./gradlew :service:bootRun
# Run server 2
SERVER_PORT=8091 ./gradlew :service:bootRun
curl http://localhost:8090/actuator/health
{"status":"UP"}
curl localhost:8090/hello
{ "message": "hello world!"}%
./gradlew :1-service-disc-by-properties:bootRun
curl localhost:8881/hello
{ "message": "hello world from port 8090!"}%
curl localhost:8881/hello
{ "message": "hello world from port 8091!"}%
You could need to run multiple times the previous commands to get a response from a different server.
curl localhost:8090/status/false -X PUT
curl http://localhost:8090/actuator/health
{"status":"DOWN"}
You could receive one response on port 8090 owing the healthcheck haven't checked the endpoint when you send the request.
The interval can be modified in the property spring.cloud.loadbalancer.health-check.interval spring.cloud.loadbalancer.health-check.interval
Also, you can see some messages that describe one of the upstream endpoints as not healthy, and therefore, it is unavailable.
2023-05-08 14:59:53.151 DEBUG 9906 --- [ctor-http-nio-3] r.n.http.client.HttpClientOperations     : [12d42e83-77, L:/127.0.0.1:57439 - R:localhost/127.0.0.1:8090] Received response (auto-read:false) : RESPONSE(decodeResult: success, version: HTTP/1.1)
HTTP/1.1 503 Service Unavailable
curl localhost:8881/hello
{ "message": "hello world from port 8091!"}%
curl localhost:8091/status/false -X PUT
curl localhost:8881/hello
{"timestamp":"2023-05-08T13:07:48.704+00:00","path":"/hello","status":503,"error":"Service Unavailable","requestId":"6b5d6010-199"}%
Having a static configuration is not very flexible, but using Eureka as a service discovery can remove that drawback.
The cost is that you require a new component in your architecture which can increase your maintenance burden. This might not be an option for some clients.
The following example configures Eureka integration:
    spring:
      application:
        name: scg-client-with-eureka
      cloud:
        loadbalancer:
          configurations: health-check # Note: required for enabling SDC with health checks - remove this line if you want to reproduce issues because not using health checks in LB
          # Note: LoadBalancerCacheProperties.ttl (or spring.cloud.loadbalancer.cache.ttl) is 35 by default - You will need to wait 35secs after an instance turns healthy
        gateway:
          httpclient:
            wiretap: true
          routes:
            - uri: lb://hello-service
              predicates:
                - Path=/headers
              filters:
                - StripPrefix=0

    eureka:
      client:
        webclient:
          enabled: true
        serviceUrl:
          defaultZone: http://localhost:8761/eureka
        fetchRegistry: true
        registerWithEureka: false
      instance:
        preferIpAddress: true
./gradlew :eureka-server:bootRun
Wait until you can see Eureka server was started up
2023-06-26 12:51:46.901 INFO 88601 --- [ Thread-9] e.s.EurekaServerInitializerConfiguration : Started Eureka Server
eureka profile# Run server 1
SPRING_PROFILES_ACTIVE=eureka SERVER_PORT=8090 ./gradlew :service:bootRun
# Run server 2
SPRING_PROFILES_ACTIVE=eureka SERVER_PORT=8091 ./gradlew :service:bootRun
You should see that the sever instances were added into Eureka in the servers' logs from step 1.
2023-06-26 12:52:50.805  INFO 88601 --- [nio-8761-exec-3] c.n.e.registry.AbstractInstanceRegistry  : Registered instance HELLO-SERVICE/192.168.0.14:hello-service:8090 with status UP (replication=true)
2023-06-26 12:53:29.127  INFO 88601 --- [nio-8761-exec-9] c.n.e.registry.AbstractInstanceRegistry  : Registered instance HELLO-SERVICE/192.168.0.14:hello-service:8091 with status UP (replication=true)
Go to http://localhost:8761/ and check the servers are included as instance of the application hello-service
Run Spring Cloud Gateway
SERVER_PORT=8883 ./gradlew :3-eureka-service-disc:bootRun
5.Test Spring Cloud Gateway balancer
curl localhost:8883/hello
{ "message": "hello world from port 8090!"}%
curl localhost:8883/hello
{ "message": "hello world from port 8091!"}%
curl localhost:8090/status/false -X PUT
You should see in the Eureka dashboard that there is only one instance available, and you will see some logs messages complaining that service on port 8090 is not available.
The health check is not immediate, so you might need to wait a few seconds to see the instance marked as DOWN.
As you have seen, Spring Cloud Gateway offers an option for creating your own custom filters. It also lets you apply filters and change routes without restarting your gateway.
In this section, you can see a custom filter implementation that sets up load balancing and health checks of your services by using Spring Cloud Gateway route configuration.
If you already have a service discovery server in your project this might not be your best option. If not, this is a simple and cheap way to integrate two great features in your project.
    spring:
      application:
        name: custom-service-disc
      cloud:
        loadbalancer:
          configurations: health-check # Note: required for enabling SDC with health checks - remove this line if you want to reproduce issues because not using health checks in LB
          # Note: LoadBalancerCacheProperties.ttl (or spring.cloud.loadbalancer.cache.ttl) is 35 by default - You will need to wait 35secs after an instance turns healthy
        gateway:
          routes:
            - uri: lb://hello-service
              id: load-balanced
              predicates:
                - Path=/load-balanced/**
              filters:
                - StripPrefix=1
                - LoadBalancer=localhost:8090;localhost:8091;localhost:8092
The new LoadBalancer route filter lets you configure the upstream service endpoints associated with the lb://hello-service load balancer URI:
@Component
public class LoadBalancerGatewayFilterFactory extends AbstractGatewayFilterFactory<LoadBalancerGatewayFilterFactory.MyConfiguration> {

	// ...

	@Override
	public GatewayFilter apply(MyConfiguration config) {
		return (exchange, chain) -> {
			final Route route = exchange.getAttribute(GATEWAY_ROUTE_ATTR);
			if (StringUtils.hasText(config.getInstances()) && route.getUri().getScheme().equals("lb")) {
				config.getServiceInstances(route.getUri().getHost()).forEach(discoveryClient::addInstance);
			}

			return chain.filter(exchange);
		};
	}
If a route matches the lb://<service-host> pattern, the LoadBalancerGatewayFilterFactory will associate all the upstream service endpoints coming from the filter configuration to the service-host.
Under the hood, a new ReactiveCustomDiscoveryClient discovery client implementation has been included to manage upstream service endpoints in our code.
Spring detects such a bean and prioritizes it in the list of DiscoveryClient used to determine available endpoints.
# Run server 1
SERVER_PORT=8090 ./gradlew :service:bootRun
# Run server 2
SERVER_PORT=8091 ./gradlew :service:bootRun
curl http://localhost:8090/actuator/health
{"status":"UP"}
curl localhost:8090/hello
{ "message": "hello world!"}%
SERVER_PORT=8882 ./gradlew :2-custom-service-disc:bootRun
curl localhost:8882/hello
{ "message": "hello world from port 8090!"}%
curl localhost:8882/hello
{ "message": "hello world from port 8091!"}%
You could need to run multiple times the previous commands to get a response from a different server.
curl localhost:8090/status/false -X PUT
curl http://localhost:8090/actuator/health
{"status":"DOWN"}
You could receive one response on port 8090 owing to the healthcheck not having checked the endpoint when you send the request.
The interval can be modified in the spring.cloud.loadbalancer.health-check.interval property.
Also, you can see some messages that describe one of the upstream endpoints as not healthy, and, therefore, it is unavailable.
2023-05-08 15:59:53.151 DEBUG 9906 --- [ctor-http-nio-2] r.n.http.client.HttpClientOperations     : [12d42e83-77, L:/127.0.0.1:57439 - R:localhost/127.0.0.1:8090] Received response (auto-read:false) : RESPONSE(decodeResult: success, version: HTTP/1.1)
HTTP/1.1 503 Service Unavailable
curl localhost:8882/hello
{ "message": "hello world from port 8091!"}%
curl localhost:8091/status/false -X PUT
curl localhost:8882/hello
{"timestamp":"2023-05-08T14:07:48.704+00:00","path":"/hello","status":503,"error":"Service Unavailable","requestId":"6b5d6010-199"}%
In this post, you have seen multiple ways to get load balancing and active health checks in your projects.
To sum up, you have also seen that the Spring Cloud Gateway approach is a great option if you do not need to add an extra component to your architecture.
Want to learn more about Spring Cloud? Join us virtually at Spring Academy!
Want to get active health check just by adding a property in your route without getting your hands dirty? Take a look at our commercial platform with Kubernetes support.

VMware offers training and certification to turbo-charge your progress.
Learn moreTanzu Spring offers support and binaries for OpenJDK™, Spring, and Apache Tomcat® in one simple subscription.
Learn moreCheck out all the upcoming events in the Spring community.
View all