Get ahead
VMware offers training and certification to turbo-charge your progress.
Learn moreIn the dynamic realm of observability, OpenTelemetry is a new set of tools that emerged from the now-deprecated OpenCensus and OpenTracing projects. When it comes to Spring Framework, Spring Boot, Spring Data, and Spring Cloud observability, mature solutions like Micrometer, the de facto Java standard of observability, are being used to instrument their various modules. The OpenTelemetry project consists of many components. The one we find most compelling is the OpenTelemetry Protocol (OTLP), which allows developers to harness the power of a consistent telemetry format for any back-end supporting OTLP. Let’s explore how Spring Boot seamlessly integrates with these tools to deliver exceptional observability.
Micrometer’s Observation API is a cornerstone of Spring Boot’s observability strategy. It offers a comprehensive observability solution that integrates seamlessly with various tracing and monitoring systems. Here’s why it’s the go-to choice for Spring Boot applications:
The OpenTelemetry Protocol (OTLP) facilitates communication between different observability tools. By leveraging OTLP, Spring Boot applications can export logging, metrics, and tracing data in a standardized format, making it easier to integrate with various backends and observability platforms. At the end of the day, it’s the protocol that matters!
Why OTLP Matters:
Spring in its core is always about abstractions and allowing developers to choose. Same goes with Micrometer, which was founded in 2016 with the statement that “it’s like SLF4J but for metrics”. Micrometer allows you to abstract your code from the actual metrics backend. As for OTLP, Micrometer supports that from 2022 via a dedicated OtlpMeterRegistry.
We wanted to introduce the same abstraction for tracing, that’s why we ported the very mature Spring Cloud Sleuth project (founded in 2014) to Micrometer Tracing so that it is Spring agnostic. Thanks to Micrometer Tracing, you can choose which tracer library you want to pick (a tracer controls the lifecycle of a span and is fundamental for distributed tracing). Micrometer Tracing supports two tracing libraries: OpenZipkin Brave (Brave) and OpenTelemetry.
We believe in mature, production tested solutions, and that’s why we think Micrometer and Brave are essential tools in the Spring Boot observability toolkit. They provide robust observability capabilities, helping developers track and analyze requests across distributed systems.
Micrometer and Brave work seamlessly with Micrometer Observation and they both support OTLP ensuring your metrics (for around 2 years) and tracing data (via a freshly released zipkin-otel project can be easily exported and utilized.
The Spring team knows the Spring Framework quite well because we work on it on a daily basis. We’re also serious about observability - that’s why we're the ones working on the instrumentation. Having the Spring expertise and knowing what our community wants allows us to build a great, customizable developer experience. We believe that framework features and how they're instrumented go together: code, documentation and support.
Nobody’s perfect - including us. We do know that we can always improve the current OpenTelemetry and Spring experience. The Spring team is currently working on making OTLP become the first class citizen as far as metrics/traces/logging/semantic conventions is concerned. This means better auto-configuration where needed, better support in libraries, and less moving parts for developers.
A picture is worth a thousand words - let’s look at the result of running the code available here.
<!-- Prerequisite for observability -->
<dependency>
	<groupId>org.springframework.boot</groupId>
	<artifactId>spring-boot-starter-actuator</artifactId>
</dependency>

<!-- For Metrics -->
<!-- For OTLP -->
<dependency>
	<groupId>io.micrometer</groupId>
	<artifactId>micrometer-registry-otlp</artifactId>
</dependency>

<!-- Brave version -->
<!-- For Tracing -->
<dependency>
	<groupId>io.micrometer</groupId>
	<artifactId>micrometer-tracing-bridge-brave</artifactId>
</dependency>
<!-- For Latency Visualization -->
<!-- For OTLP -->
<dependency>
	<groupId>io.zipkin.contrib.otel</groupId>
	<artifactId>encoder-brave</artifactId>
	<version>0.1.0</version>
</dependency>

<!-- For pushing logs out -->
<dependency>
	<groupId>com.github.loki4j</groupId>
	<artifactId>loki-logback-appender</artifactId>
	<version>1.5.2</version>
	<scope>runtime</scope>
</dependency>
Maven setup required to have Spring Boot with Open Telemetry (OTLP) through Micrometer Observation, Micrometer Core and Micrometer Tracing.

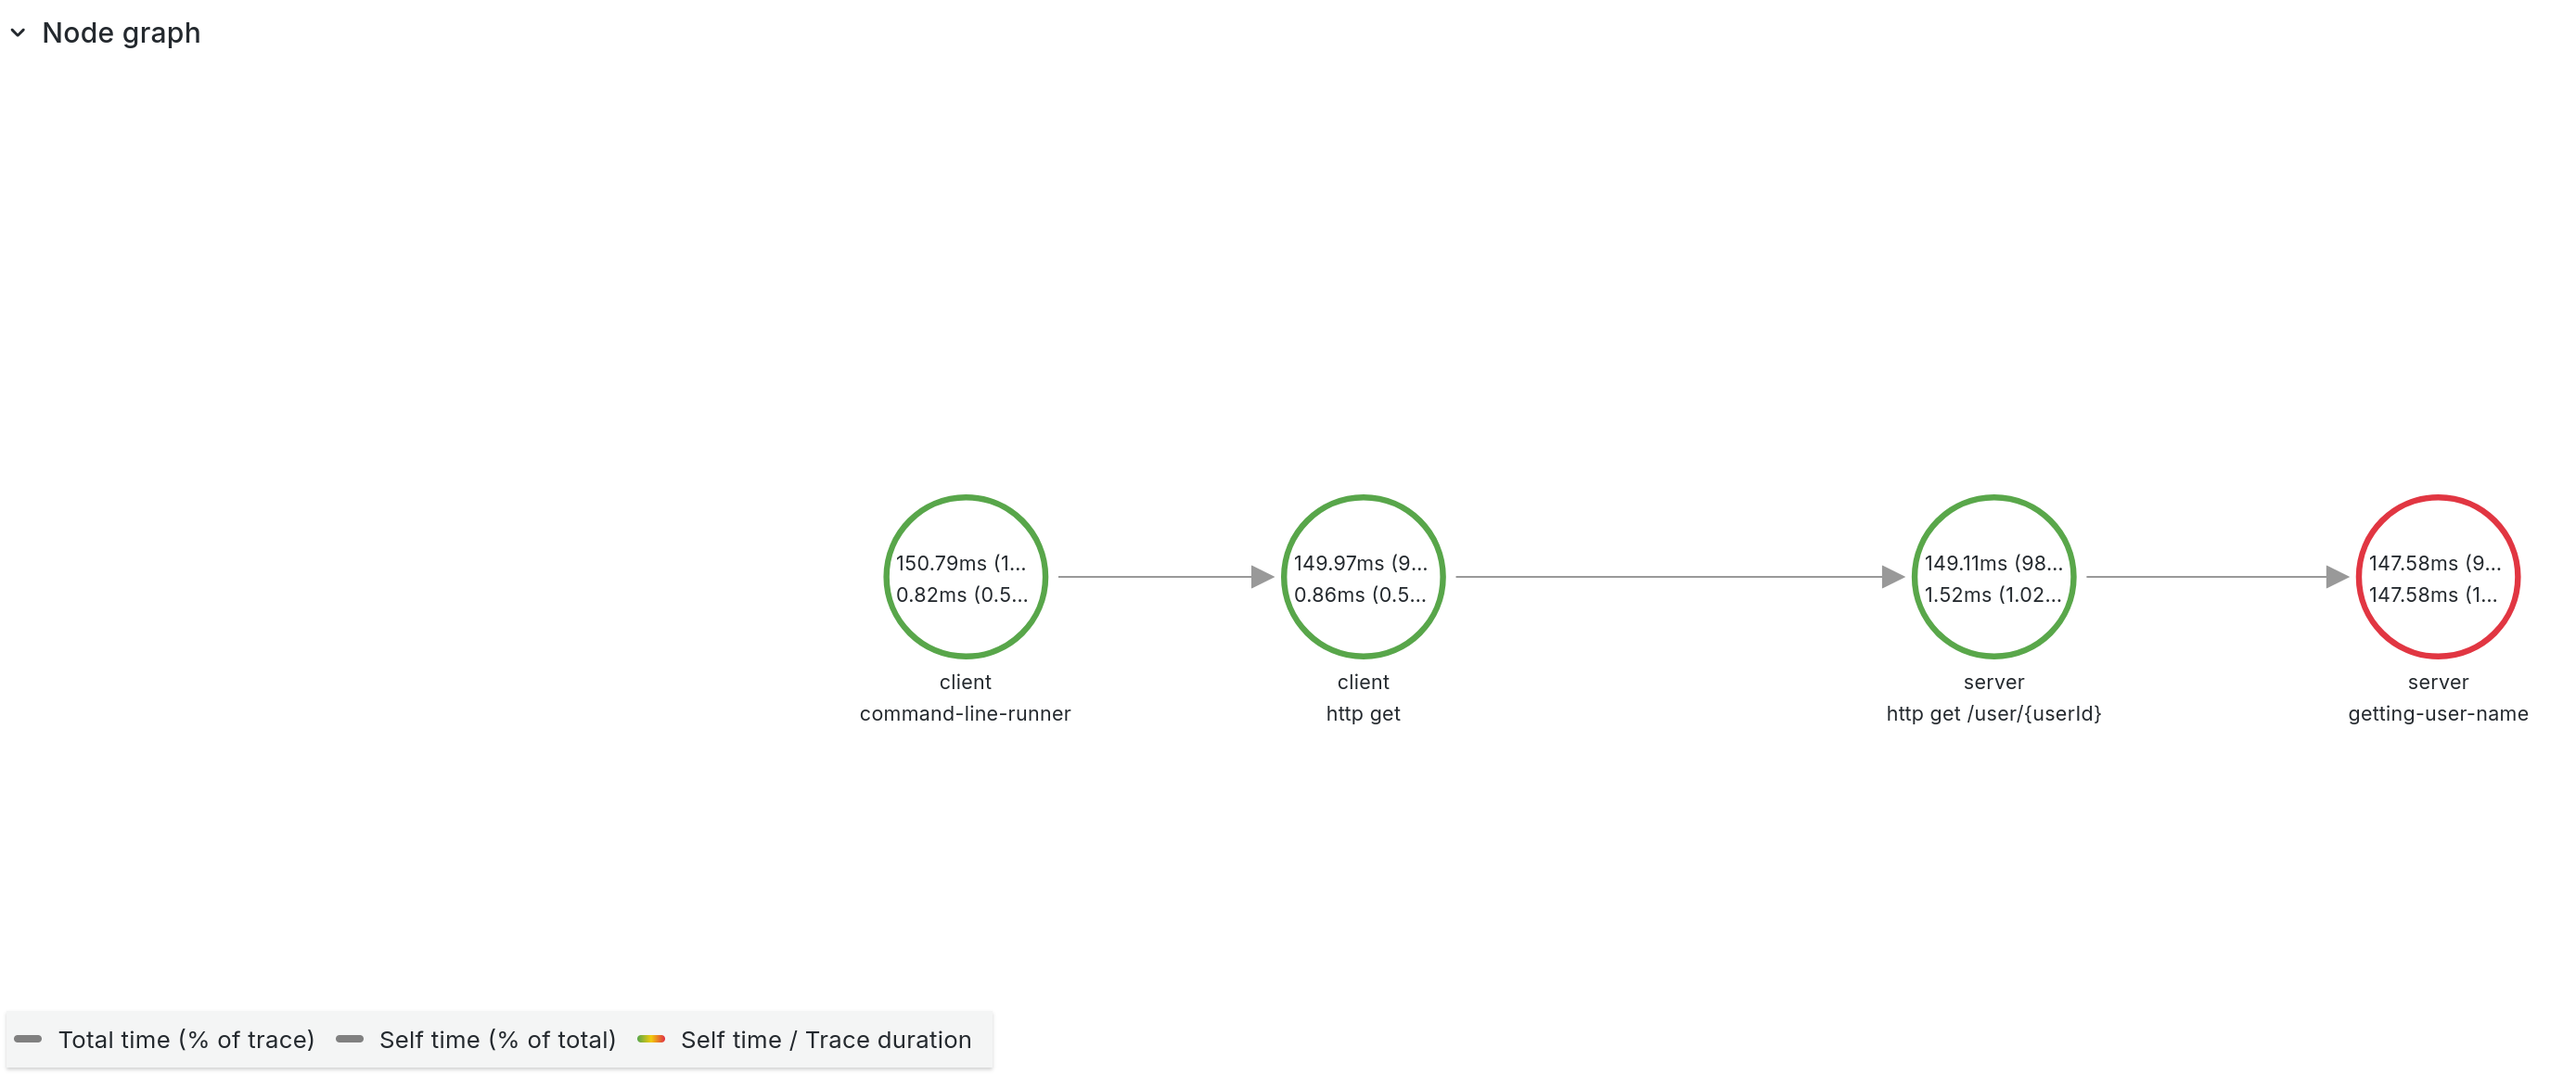
Node graph of client command line application making an HTTP call to the server side

Log correlation through Spring Boot, Micrometer Observation, Micrometer Tracing and OpenZipkin Brave bridge

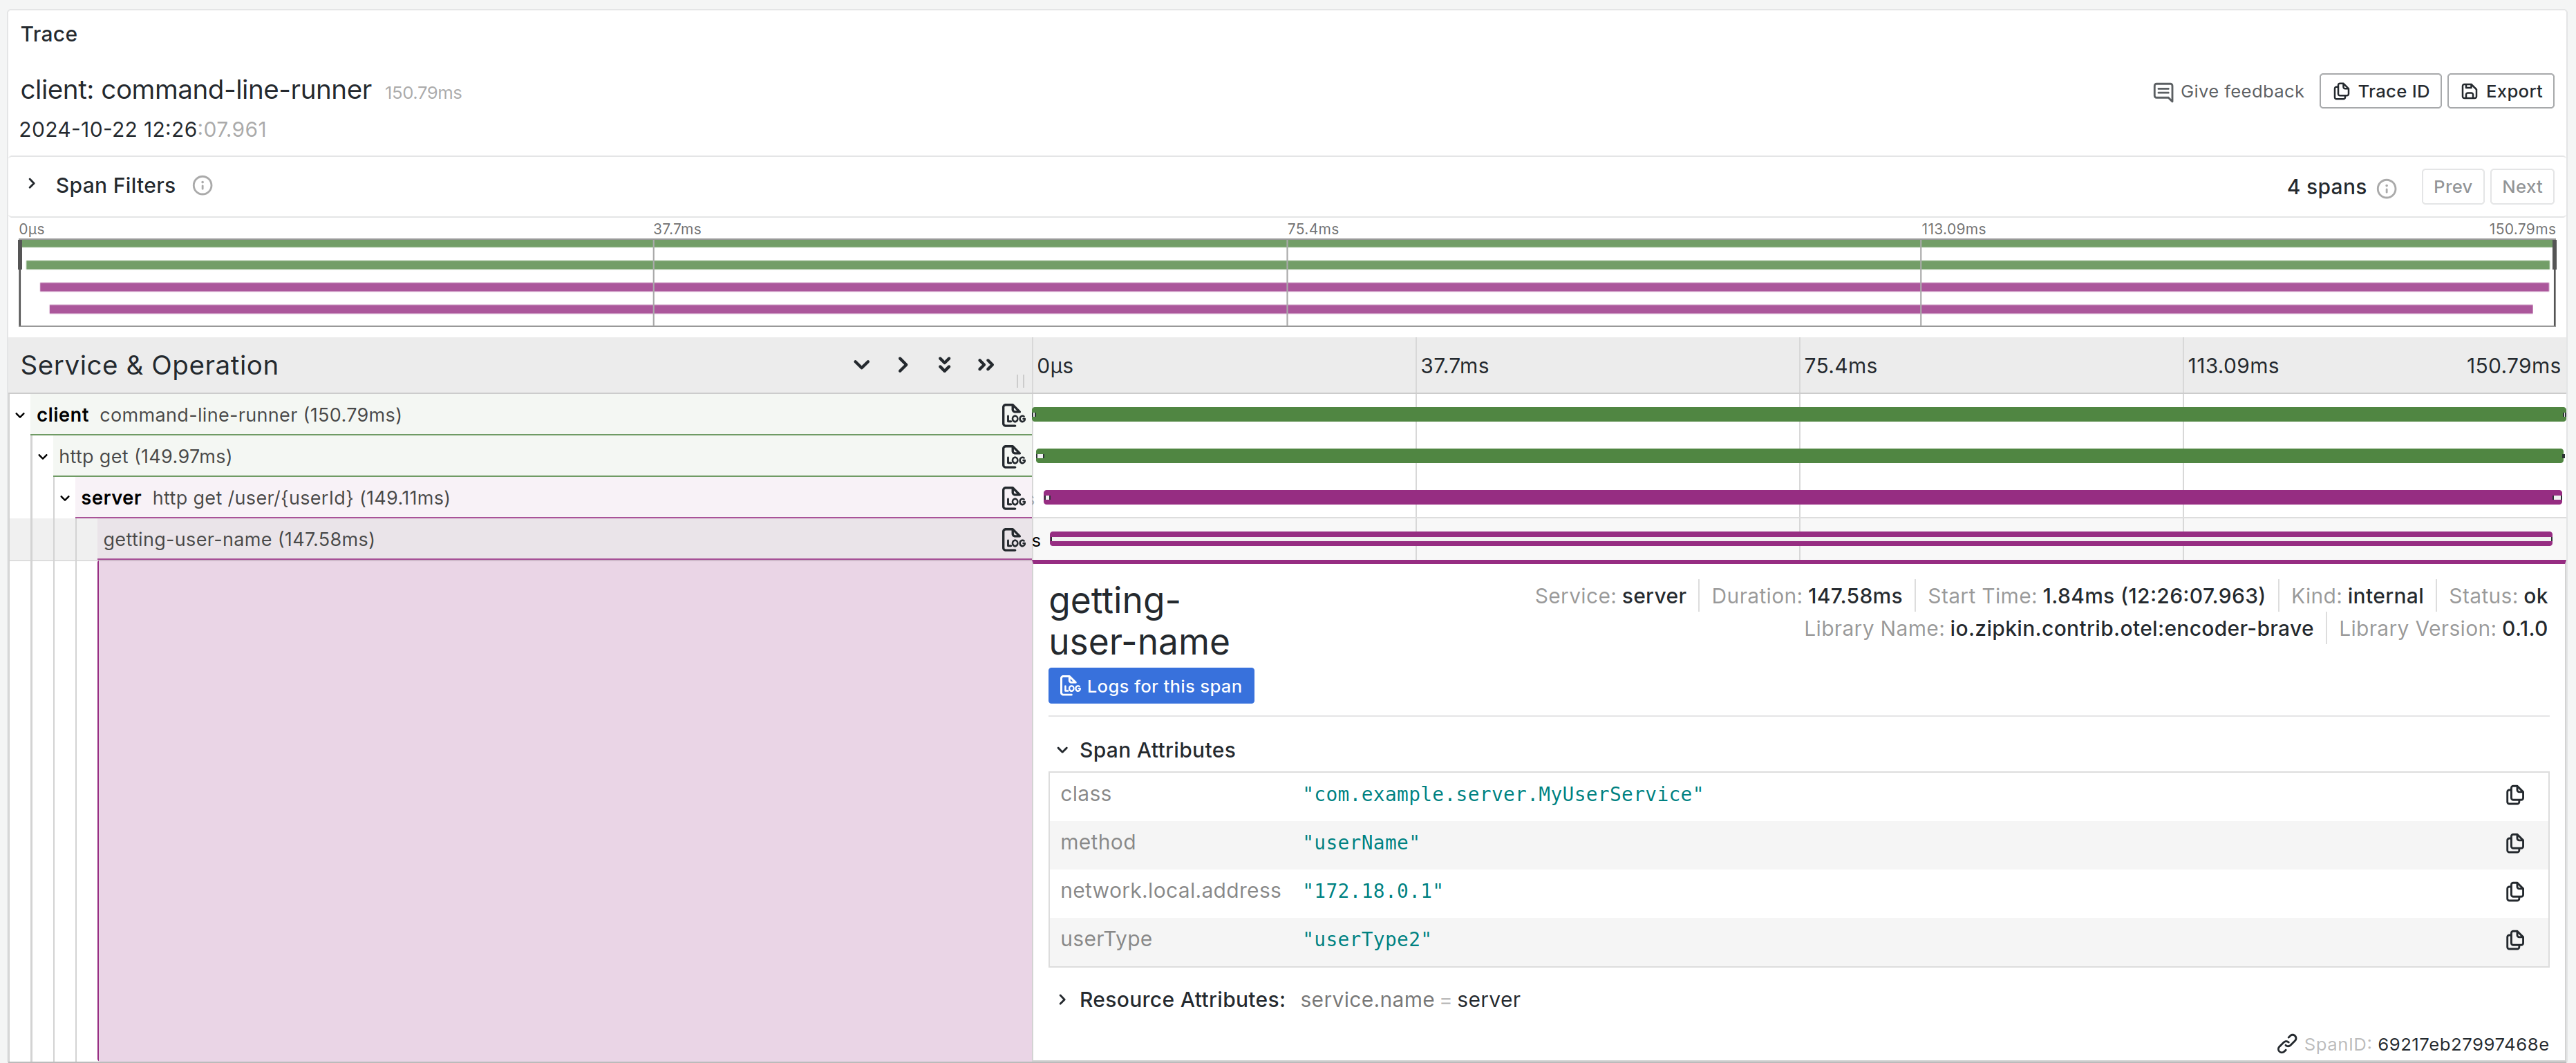
Trace view - span data received in OTLP format via OTel Brave Encoder (also through Micrometer Observation, Micrometer Tracing and OpenZipkin Brave bridge)

Latency of the incoming requests through Spring Boot with Micrometer Observation, Micrometer Core, Micrometer OTLP push MeterRegistry and OTLP write receiver enabled on the Prometheus side
Spring Boot’s Observability Approach:
Spring Boot’s embrace of OpenTelemetry principles through the use of OTLP, Micrometer for metrics, Brave for tracing and Micrometer Observation as a common abstraction demonstrates a commitment to robust and reliable observability. By leveraging these tools, developers can achieve comprehensive observability. This approach not only simplifies the observability setup but also ensures a stable and mature framework for production environments. Spring Boot is a great fan of OpenTelemetry, and it shows in how effortlessly it integrates with these powerful observability tools.