Get ahead
VMware offers training and certification to turbo-charge your progress.
Learn moreThis article is part of a blog series that explores the newly redesigned Spring Cloud Stream applications based on Java Functions.
Here are all the previous parts of this blog series.
In this post, we will look at the Debezium CDC source that allows us to capture database changes from databases such as MySQL, PostgreSQL, MongoDB, Oracle, DB2 and SQL Server and process those changes, in real-time, over various message binders, such as RabbitMQ, Apache Kafka, Azure Event Hubs, Google PubSub and Solace PubSub+ to name a few.
Also we will reveal how to use the Analytics sink to convert the captured database changes into metrics and publish them to various monitoring systems for further analysis.
This article starts by explaining the CDC supplier and the Analytics consumer components, showing how to customize and use them programmatically in your own Spring applications. Next we explain how the CDC source and the Analytics sink, build upon the supplier and the consumer, to provide out of the box, ready to use streaming applications.
Finally we will demo how easy is it to use Spring Cloud Data Flow (SCDF) for deploying streaming pipelines that react, in real-time, to database updates, convert the change events into analytics metrics and publish them to Prometheus for analysis and visualization with Grafana:
Change Data Capture (CDC) is a technique for observing all data changes written to a database and publishing them as events that can be processed in a streamed fashion. As your application database is always changing, the CDC allows you to react to those changes and lets your applications stream every row-level change in the same order as they were committed to the database.
CDC enables a multitude of use-cases such as: cache invalidation, in-memory data views, update search indexes, data replication by keeping different data sources in sync, real-time fraud detection, storing audit trails, data provenance and much more.
The Spring Cloud Data Flow CDC Source application is built around Debezium, a popular, open source, log-based CDC implementation that supports various databases. The CDC Source supports a variety of message binders, including Apache Kafka, Rabbit MQ, Azure Event Hubs, Google PubSub, Solace PubSub+.
Note
The CDC source implementation embeds the Debezium Engine and it does not depend on Apache Kafka nor ZooKeeper! You can use the CDC source along with any of the supported message binders! The the Debezium Engine though comes with some limitations to be considered.
The CDC Debezium Supplier is implemented as java.util.function.Supplier bean which when invoked will deliver the contents of the files in a given directory. The file supplier has the following signature:
Supplier<Flux<Message<?>>>
The users of the supplier can subscribe to the returned Flux<Message<?>, which is a stream of messages or CDC Change Events, that have a complex structure. Each event consists of three parts (e.g. metadata, before and after) as shown in the following payload sample:
{
  "before": { ... },  // row data before the change.
  "after": { ... },  // row data after the change.
  "source": {  //  the names of the database and table where the change was made.
    "connector": "mysql", "server_id": 223344,"snapshot": "false",
    "name": "my-app-connector", "file": "mysql-bin.000003", "pos": 355, "row": 0,
    "db": "inventory",  // source database name.
    "table": "customers", // source table name.
  },
  "op": "u",  // operation that made the change.
  "ts_ms": 1607440256301, // timestamp - when the change was made.
  "transaction": null  // transaction information (optional).
}
If the cdc.flattening.enabled property is set to true, then only the after section is passed as a standalone message.
In order to invoke the CDC supplier, we need to specify a source database to receive the CDC events from. The cdc.connector property is used to choose between the supported mysql, postgres, sql server, db2, oracle, cassandra and mongo source database types.. The cdc.config.database.* properties help to configure the the source access. Here is a sample configuration for connecting to a MySQL databases:
# DB type
cdc.connector=mysql

# DB access
cdc.config.database.user=debezium
cdc.config.database.password=dbz
cdc.config.database.hostname=localhost
cdc.config.database.port=3306

# DB source metadata
cdc.name=my-sql-connector
cdc.config.database.server.id=85744
cdc.config.database.server.name=my-app-connector
The cdc.name, cdc.config.database.server.id and cdc.config.database.server.name properties are used to identify and dispatch the incoming events. Optionally you can set the cdc.flattening.enabled=true to flatten the CDC events to replace the original change event with only its after field to create a simple Kafka record. Optionally use the cdc.schema=true to include the DB schema to the CDC events.
Note
The source database must be configured to expose its Write-Ahead Log API for the Debezium to be able to connect and consume CDC events. The Debezium Connector Documentation provides fine description of how to enable the CDC for any of the supported databases. For the purpose of our demos here we will use a preconfigured MySQL docker image.
The CDC supplier is a reusable Spring bean that we can inject in end-user custom applications. Once injected, this can be directly invoked and combined with custom processing of the data. Here is an example.
@Autowired
Supplier<Flux<Message<?>>> cdcSupplier;

public void consumeDataAndSendEmail() {
  Flux<Message<?> cdcData = cdcSupplier.get();
  messageFlux.subscribe(t -> {
      if (t == something)
         //send the email here.
      }
  }
}
In the above pseudo-code, we inject the CDC supplier bean and then use it to invoke its get() method to get a Flux. We then subscribe to that Flux and each time we receive any data through the Flux, apply some filtering, and take actions based on that. This is just a simple illustration to show how we can reuse the CDC supplier. When you try this in a real application, you probably need to make more adjustments in your implementation, such as converting the default data type of the received data from byte[] into something else before doing the conditional check.
Tip
For building a standalone, non-streaming, application you can leverage the cdc-debezium-boot-starter. Just add the cdc-debezium-boot-starter dependency and implement your custom Consumer<SourceRecord> handler to process the incoming database change events.
As we have seen in this blog series, all the out of the box Spring Cloud Stream source applications are already autoconfigured with several out of the box general-purpose processors. You can activate these processors as part of the CDC source. Here is an example, where we run the CDC source and receive the data and then transforms the consumed data before sending it out to the destination on middleware.
java -jar cdc-debezium-source.jar
 --cdc.connector=mysql --cdc.name=my-sql-connector
 --cdc.config.database.server.name=my-app-connector
 --cdc.config.database.user=debezium --cdc.config.database.password=dbz
 --cdc.config.database.hostname=localhost --cdc.config.database.port=3306
 --cdc.schema=true
 --cdc.flattening.enabled=true
 --spring.cloud.function.definition=cdcSupplier|spelFunction
 --spel.function.expression=payload.toUpperCase()
By providing the value, cdcSupplier|spelFunction for the spring.cloud.function.definition property, we are activating the spel function composed with the CDC supplier. Then we provide a SpEL expression that we want to use to transform the data using spel.function.expression. There are several other functions available to compose this way. Take a look here for more details.
The Analytics consumer provides a function that computes analytics from the input data messages and publishes them as metrics to various monitoring systems. It leverages the micrometer library for providing a uniform programming experience across the most popular monitoring systems and uses Spring Expression Language (SpEL) for defining how the metric names, values and tags are computed from the input data.
We can use the consumer bean directly in our custom applications to compute analytics from the passing messages. Here is the type signature of the Analytics consumer bean:
Consumer<Message<?>> analyticsConsumer
Once injected into a custom application, users can directly invoke the accept() method of the consumer and provide a Message<?> object to compute and publish the analytics to the backend monitoring system.
The Message is a generic container for data. Each Message instance includes a payload and headers containing user-extensible properties as key-value pairs. The SpEL expressions are used to access message’s headers and payload to compute metrics amounts and tags. For example a counter metrics can have a value amount computed from the size of the input message payload add a my_tag tag, extracted from the kind header value:
analytics.amount-expression=payload.lenght()
analytics.tag.expression.my_tag=headers['kind']
The Analytics consumer configuration properties start with the analytics.* prefix. Consult the AnalyticsConsumerProperties for the available analytics properties. The monitoring configuration properties start with a management.metrics.export prefix. For configuring a particular monitoring system follow the provided configuration instructions.
As in the case of CDC Source, the Spring Cloud Stream out of the box applications already provide an Analytics sink based on the Analytics consumer.
The sink is available for both Apache Kafka and RabbitMQ binder variants. When used as a Spring Cloud Stream sink, the Analytics consumer is automatically configured to accept data from the respective middleware system, for example, from a Kafka topic or RabbitMQ exchange.
Running both CDC source and Analytics sink standalone was fine, but Spring Cloud Data Flow makes it really easy to run them as a pipeline. Basically we want to orchestrate data flows that looks like this:
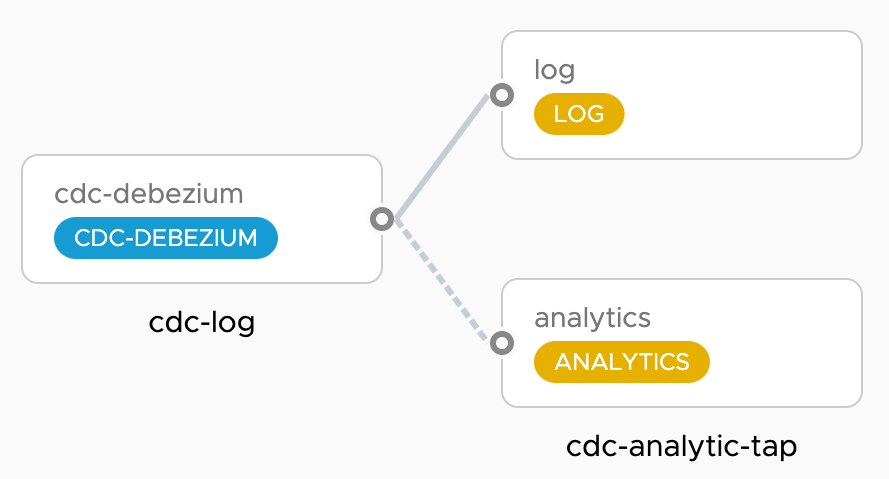
The cdc-log pipeline deploys a cdc-source that streams all database changes into a log-sink using JSON message format. In parallel the cdc-analytics-tap pipeline taps the cdc-source output into an analytics-sink to compute DB statistics from the CDC events and publish them to time-series database (TSDB) such as Prometheus or Wavefront. The Grafana dashboard is used to visualize those changes.
The Spring Cloud Data Flow installation instructions explains how to install Spring Cloud Data Flow fore any of the supported cloud platforms.
Below, we will briefly provide the steps to set up Spring Cloud Data Flow. First, we need to get the docker-compose files for running Spring Cloud Data Flow, Prometheus and Grafana:
wget -O docker-compose.yml https://raw.githubusercontent.com/spring-cloud/spring-cloud-dataflow/v2.7.0/spring-cloud-dataflow-server/docker-compose.yml

wget -O docker-compose-prometheus.yml https://raw.githubusercontent.com/spring-cloud/spring-cloud-dataflow/v2.7.0/spring-cloud-dataflow-server/docker-compose-prometheus.yml
Also, get this additional docker-compose file to install a source MySQL database configured to expose its write-ahead log that the cdc-debezium connects to.
wget -O mysql-cdc.yml https://gist.githubusercontent.com/tzolov/48dec8c0db44e8086916129201cc2c8c/raw/26e1bf435d58e25ff836e415dae308edeeef2784/mysql-cdc.yml
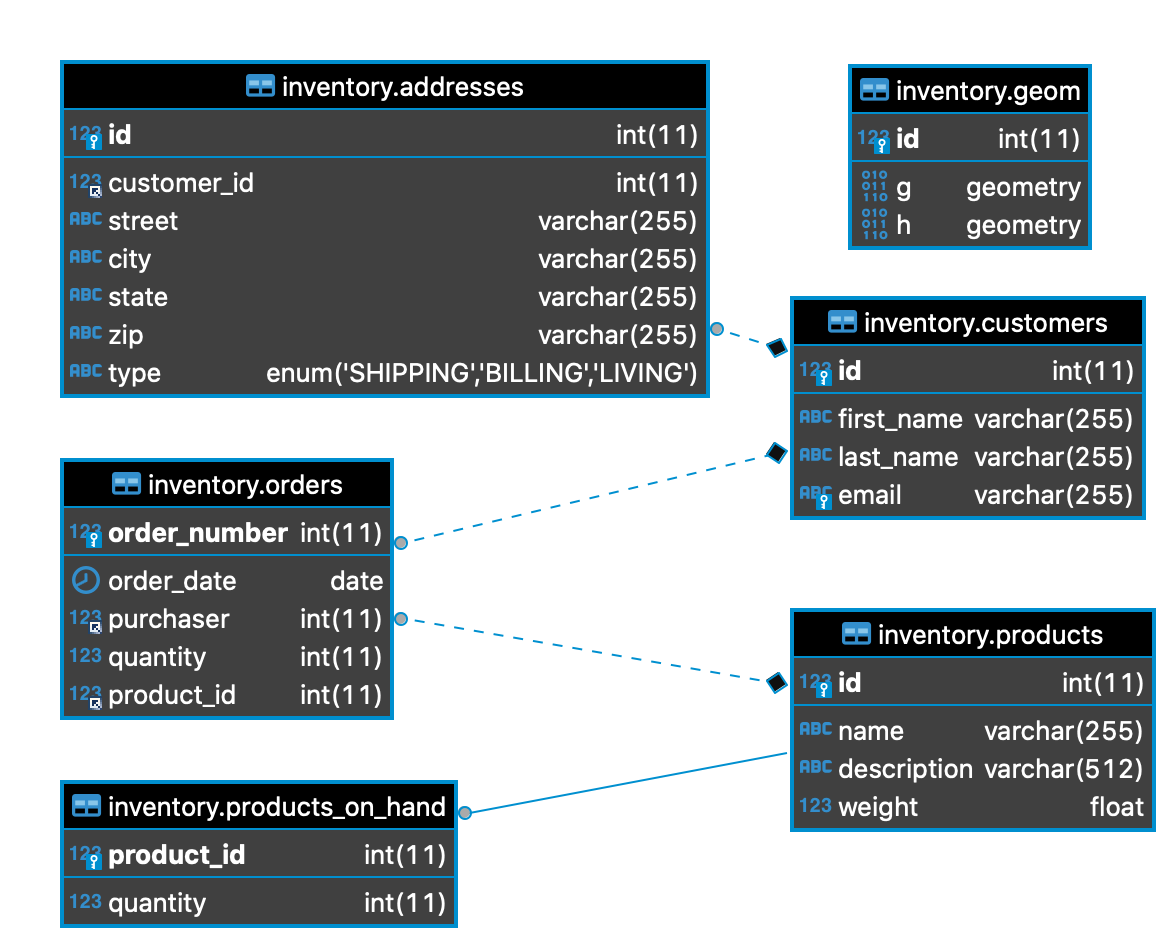
The mysql-cdc uses the debezium/example-mysql image and comes with an inventory, sample database:
We need to set up a few environment variables in order to run Spring Cloud Data Flow properly.
export DATAFLOW_VERSION=2.7.1
export SKIPPER_VERSION=2.6.1
export STREAM_APPS_URI=https://dataflow.spring.io/kafka-maven-latest
Now that we have everything ready to go, it is time to start running Spring Cloud Data Flow and all the other ancillary components.
docker-compose -f docker-compose.yml -f docker-compose-prometheus.yml -f mysql-cdc.yml up
Tip
To use RabbitMQ instead of Apache Kafka you can download an additional docker-compose file as explained in the RabbitMQ Instead of Kafka instructions, and set the STREAM_APPS_URI variable to https://repo.spring.io/libs-snapshot-local/org/springframework/cloud/stream/app/stream-applications-descriptor/2020.0.0-SNAPSHOT/stream-applications-descriptor-2020.0.0-SNAPSHOT.stream-apps-rabbit-maven instead.
Tip
To use Wavefront instead of Prometheus & Grafana, follow the Wavefront instructions.
Once SCDF is up and running, go to http://localhost:9393/dashboard. Then go to Streams on the left-hand side and select Create Stream. Select cdc-debezium from the source applications and log and analytics from the sink applications to define the cdc-log = cdc-debezium | log and the cdc-analytic-tap = :cdc-log.cdc-debezium > analytics pipelines. You can click on the application’s options to select the desired properties.
For a quicker bootstrap, you can copy/paste the following ready to use pipeline definition snippets:
cdc-log = cdc-debezium --cdc.name=mycdc --cdc.flattening.enabled=false --cdc.connector=mysql --cdc.config.database.user=debezium --cdc.config.database.password=dbz --cdc.config.database.dbname=inventory --cdc.config.database.hostname=mysql-cdc --cdc.config.database.port=3307 --cdc.stream.header.offset=true --cdc.config.database.server.name=my-app-connector --cdc.config.tombstones.on.delete=false | log

cdc-analytic-tap = :cdc-log.cdc-debezium > analytics --analytics.name=cdc --analytics.tag.expression.table=#jsonPath(payload,'$..table') --analytics.tag.expression.operation=#jsonPath(payload,'$..op') --analytics.tag.expression.db=#jsonPath(payload,'$..db')
The cdc-log pipeline deploys a cdc-debezium source that connects to an MySQL database at mysql-cdc:3307 and streams the DB change events to the log sink. Consult the cdc-debezium docs for the available configuration options.
The cdc-analytic-tap pipeline taps into the output of the cdc-debezium source and streams the cdc events to an analytics sink. The analytics creates a metrics counter (called cdc) and uses SpEL expressions to compute metrics tags (e.g. db, table and operations) from the streamed message payloads.
For example, let’s modify the customers table in the MySQL inventory database. The update transaction is sent as a change event to the cdc-debezium source, that converts the native DB event into an uniform message payload like this:
{
  "before": {
    "id": 1004, "first_name": "Anne", "last_name": "Kretchmar", "email": "[email protected]"
  },
  "after": {
    "id": 1004, "first_name": "Anne2", "last_name": "Kretchmar", "email": "[email protected]"
  },
  "source": {
    "version": "1.3.1.Final", "connector": "mysql", "server_id": 223344, "thread": 5,
    "name": "my-app-connector", "file": "mysql-bin.000003", "pos": 355, "row": 0,
    "db": "inventory",
    "table": "customers",
  },
  "op": "u",
  "ts_ms": 1607440256301,
  "transaction": null
}
The following SpEL expressions are used to compute 3 tags (db, table, operation) from the CDC message payload. Those tags are assigned to every cdc metrics published to Prometheus.
--analytics.tag.expression.db=#jsonPath(payload,'$..db')
--analytics.tag.expression.table=#jsonPath(payload,'$..table')
--analytics.tag.expression.operation=#jsonPath(payload,'$..op')
Here is a screenshot of how it should look after all the properties are selected:
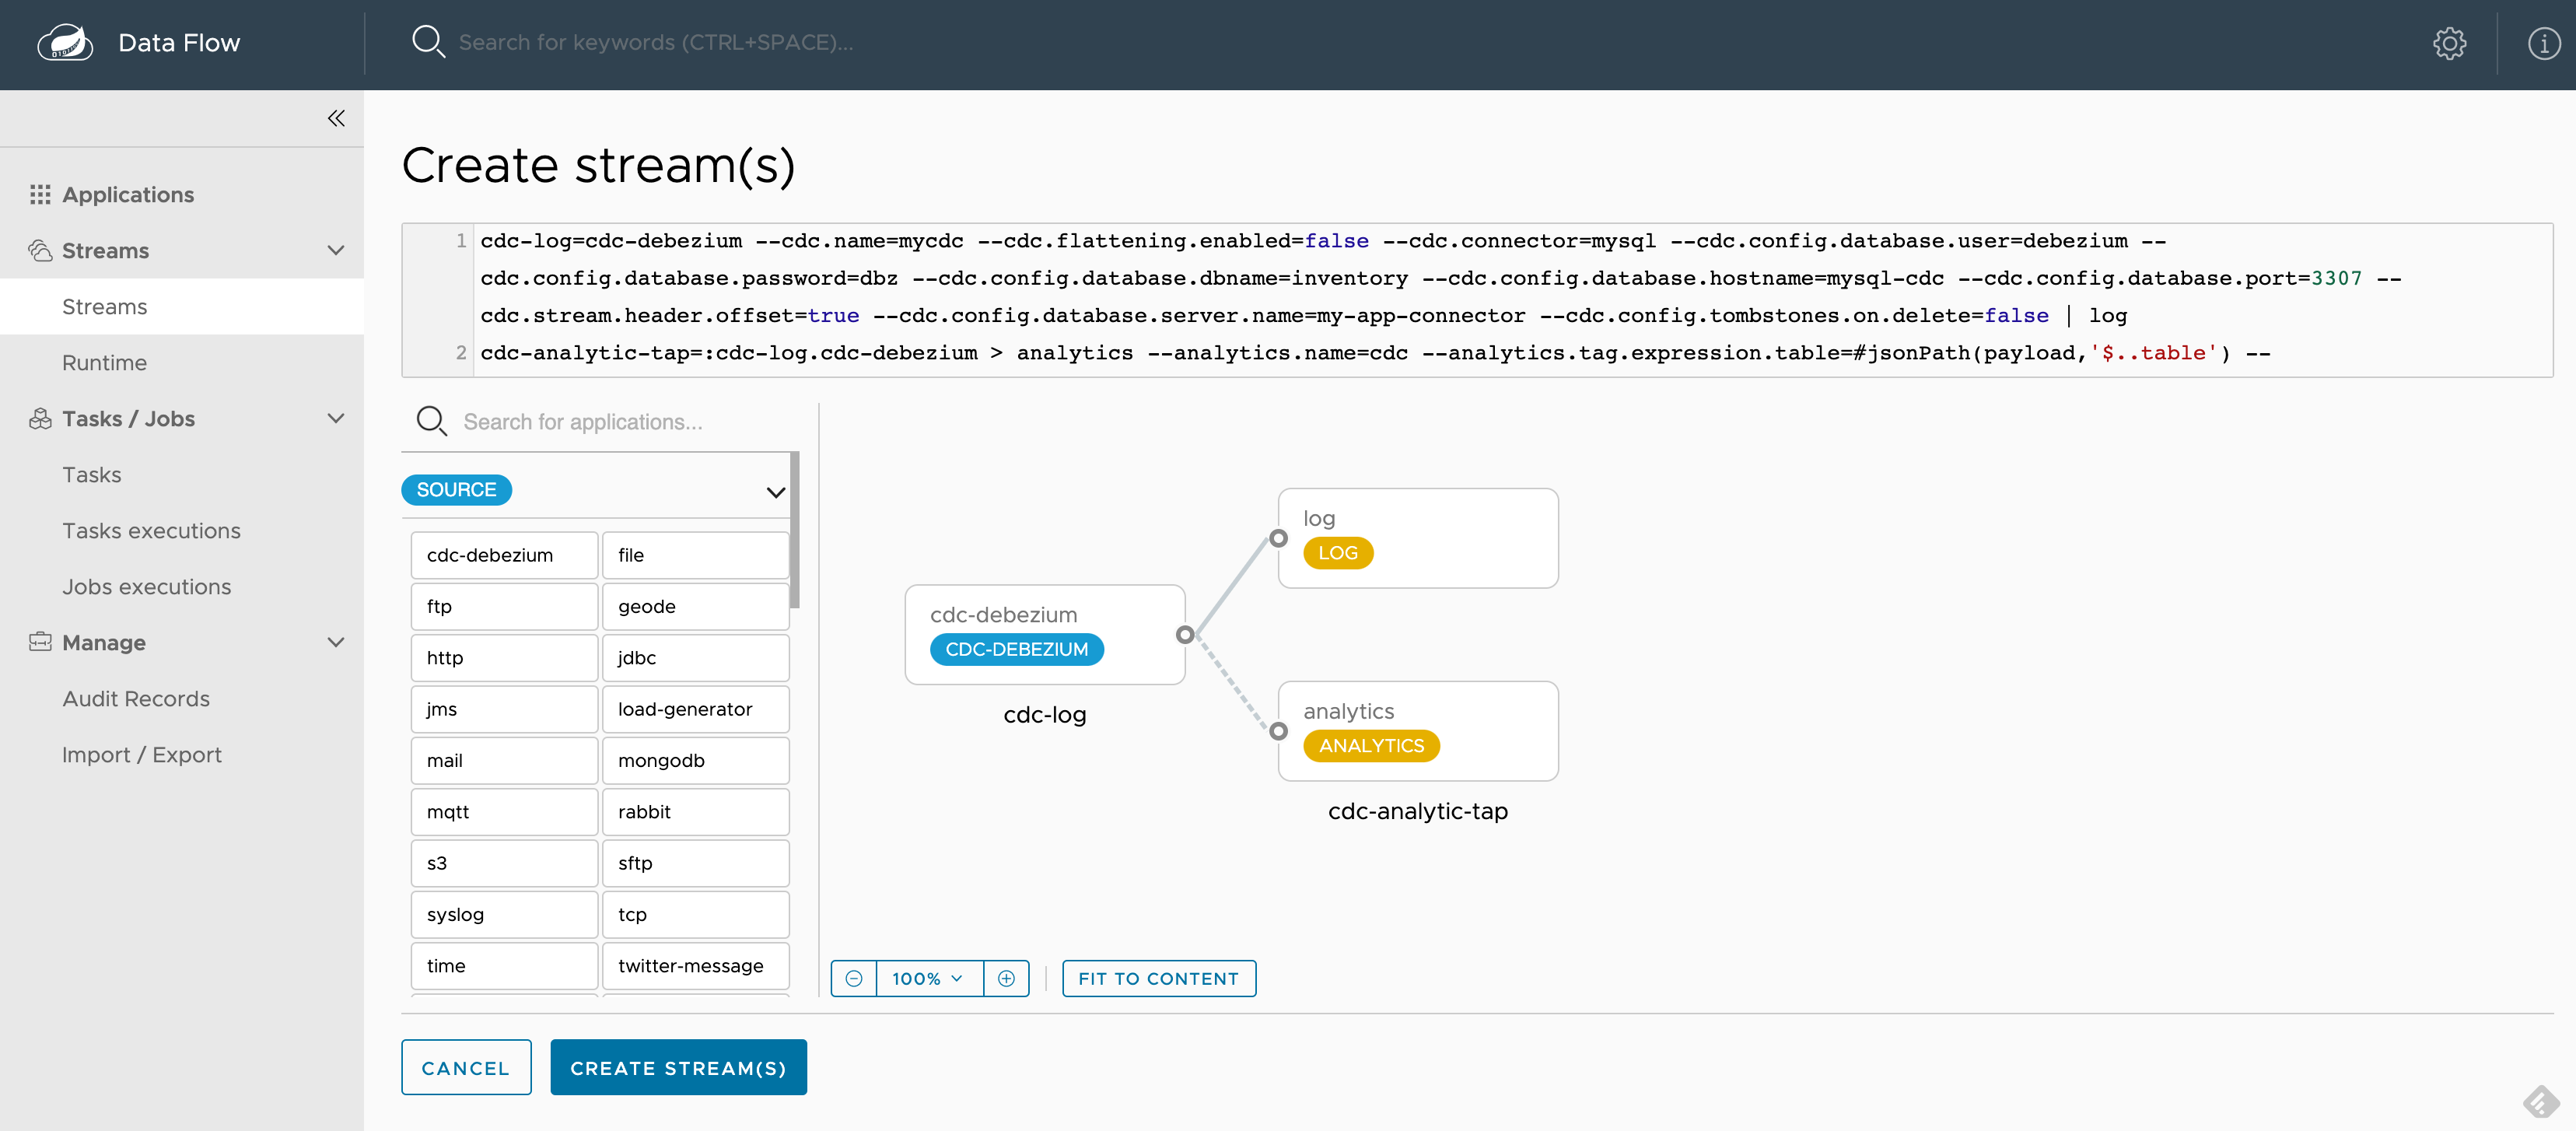
Create and deploy the cdc-log and the cdc-analytics-tap pipelines, accepting all the default options. Optionally you can use the Group Actions to deploy both streams simultaneously.
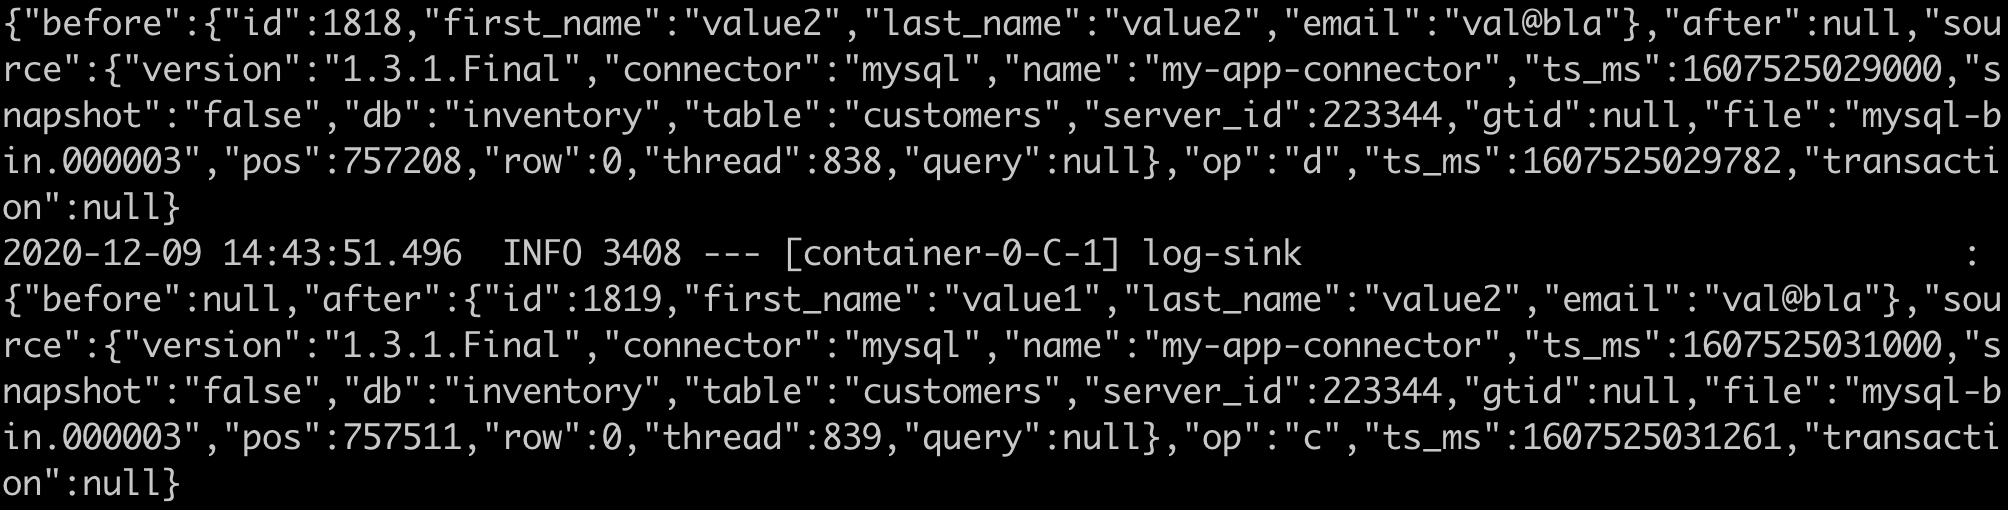
Once the streams are deployed you can check the logs of the deployed applications via the SCDF UI or using the Skipper docker container as explained in the documentation. If you check the logs of the Log sink application you should see the CDC JSON messages similar to those:
Next go to the Grafana Dashboard using the buttons (or just open localhost:3000) and login as user:`admin` and password:`admin`. You can explore the Applications dashboard to check the performance of the deployed pipelines. Now you can import the CDC Grafana Dashboard-Prometheus.json dashboard and see a dashboard similar to this:
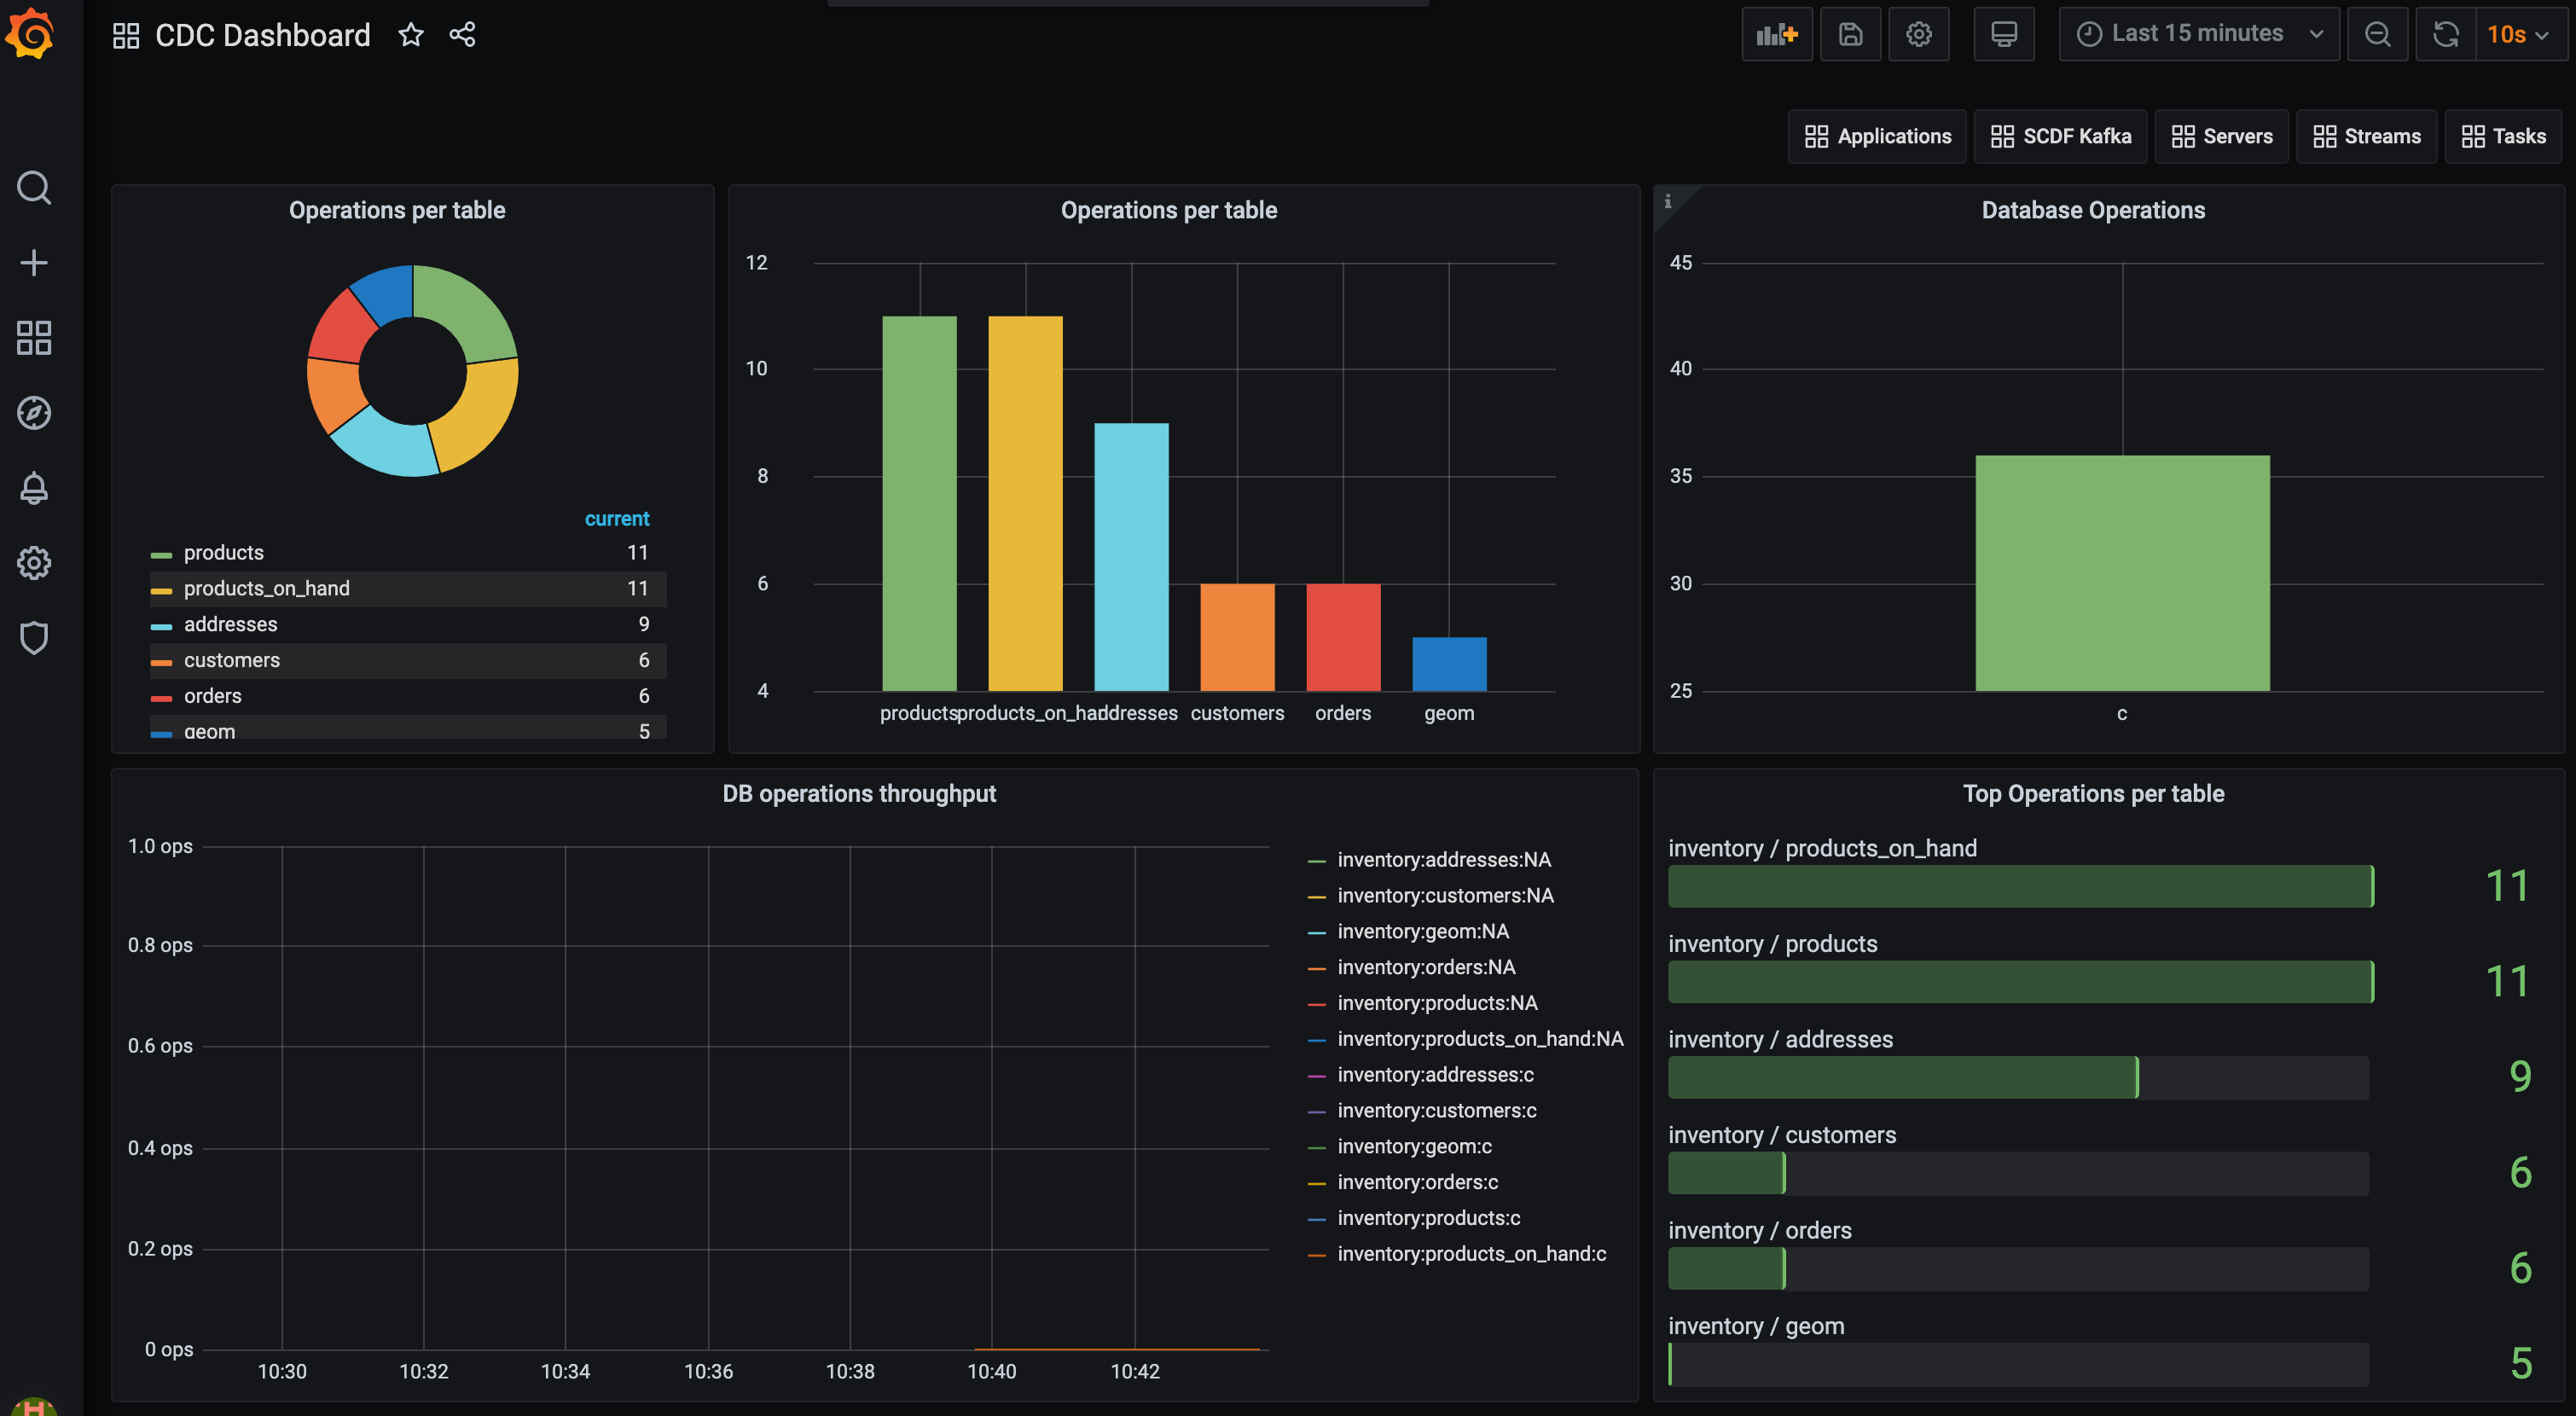
The following queries have been used to aggregate the cdc_total metrics inside Prometheus:
sort_desc(topk(10, sum(cdc_total) by (db, table)))
sort_desc(topk(100, sum(cdc_total) by (op)))
Tip
You can open the Prometheus UI at http://localhost:9090 to check the configuration as well as run some ad hoc PQL queries.
You can connect to the inventory CDC MySQL databases at localhost:3307 (user: root and password: debezium) and start modifying the data.
The following docker command shows how to connect to the mysql-cdc:
docker exec -it mysql-cdc mysql -uroot -pdebezium --database=inventory
The following script helps to generate multiple insert, update and delete DB transactions:
for i in {1..100}; do docker exec -it mysql-cdc mysql -uroot -pdebezium --database=inventory -e'INSERT INTO customers (first_name, last_name, email) VALUES ("value1", "value2", "val@bla"); UPDATE customers SET first_name="value2" WHERE first_name="value1"; DELETE FROM customers where first_name="value2";'; done
You will see the log-sink logs reflecting those changes as well as the CDC dashboard charts updates.
In this blog, we saw how the CDC-debezium supplier and the Analytics consumer functions and their corresponding Spring Cloud Stream source and sink work. The supplier and consumer functions can be injected into custom applications for combining with other business logic.
The source and the sink applications are provided out of the box for use with Kafka and RabbitMQ middleware variants.
You can easily build standalone applications combining the Cdc-debezium supplier with Geode consumer to create and maintain an in-memory view of your database data. Similarly you can combine the Cdc-debezium supplier with the Elasticsearch consumer for maintaining in real-time a searchable index for your database data.
What is more exciting is that you can realize the above scenarios using the OOTB cdc-debezium source , geode sink and elasticsearch sink applications. You can build those pipelines over different message binders and source databases.
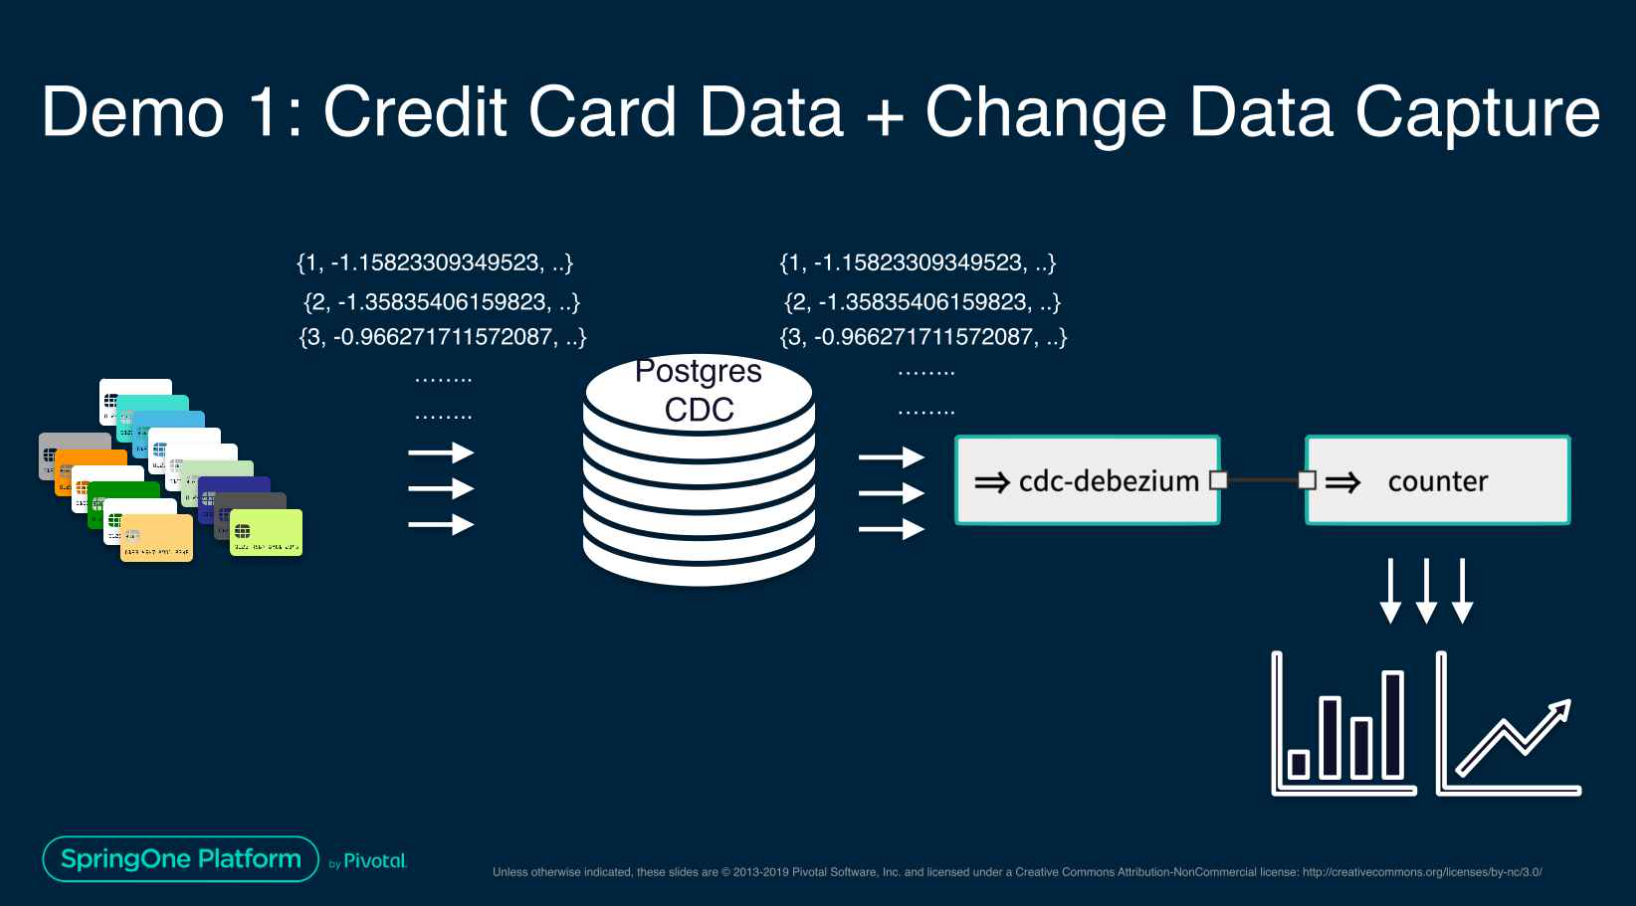
This Spring One presentation demonstrates an advanced use-case, using CDC-debezium and Machine Learning to build a streaming data pipeline for credit card fraud detection.
We still have a few more episodes coming up in this blog series. Please stay tuned.

VMware offers training and certification to turbo-charge your progress.
Learn moreTanzu Spring offers support and binaries for OpenJDK™, Spring, and Apache Tomcat® in one simple subscription.
Learn moreCheck out all the upcoming events in the Spring community.
View all